AI Skills for Life and Work: Employer survey findings
Published 28 January 2026

Ā© Crown copyright 2026
This publication is licensed under the terms of the Open Government Licence v3.0 except where otherwise stated. To view this licence, visit or write to the Information Policy Team, The National Archives, Kew, London TW9 4DU, or email: psi@nationalarchives.gov.uk.
Where we have identified any third party copyright information you will need to obtain permission from the copyright holders concerned.
This publication is available at /government/publications/ai-skills-for-life-and-work-employer-survey-findings/ai-skills-for-life-and-work-employer-survey-findings--2
This report was authored by Oliver Fenton, Jamie Douglas, and Eva Radukic at Ipsos.
This research was supported by the Department for Science, Innovation and Technology (DSIT) and theĀ R&DĀ Science and Analysis Programme at the Department for Culture, Media and Sport (DCMS). It was developed and produced according to the research teamā€™s hypotheses and methods between November 2023 and March 2025. Any primary research, subsequent findings or recommendations do not represent UK Government views or policy.
This report has been converted from a slide deck report.
1. Background and methodology
1.1 Objectives
“”²õ²õ±š²õ²õĢżAIĀ skills in work related to
- °ä³Ü°ł°ł±š²Ō³ŁĢżAIĀ usage and skills levels
- ±į“Ē·ÉĢżAI-relevant skills might transform as tech develops
- Whether the UK is supportingĀ AIĀ skill development
- What government / employers / educators should focus on to address gaps in provision
1.2 Methodology
- CATI and online survey
- Fieldwork dates: 19 March ā€“ 7 June 2024
- Audience: UK employers (i.e. excluding sole traders)
- Sample size: 801 (755 CATI and 46 online)
- Representative of UK employers across all business sectors apart from the public sector
2. Key findings
-
31% of employers currently useĀ AI.
- 39% ofĀ AI-using employers currently use real-time conversationalĀ AI, such as ChatGPT.
- 61% of employers have no current staff working withĀ AI.
- 4% of employers have tried to recruit someone to work withĀ AIĀ in the last 3 years.
- 21% of employers think demand forĀ AIĀ skills is likely to increase over the next 12 months.
- 11% of employers have had staff undertake training onĀ AIĀ in the last 12 months.
3. Usage ofĀ AIĀ among businesses
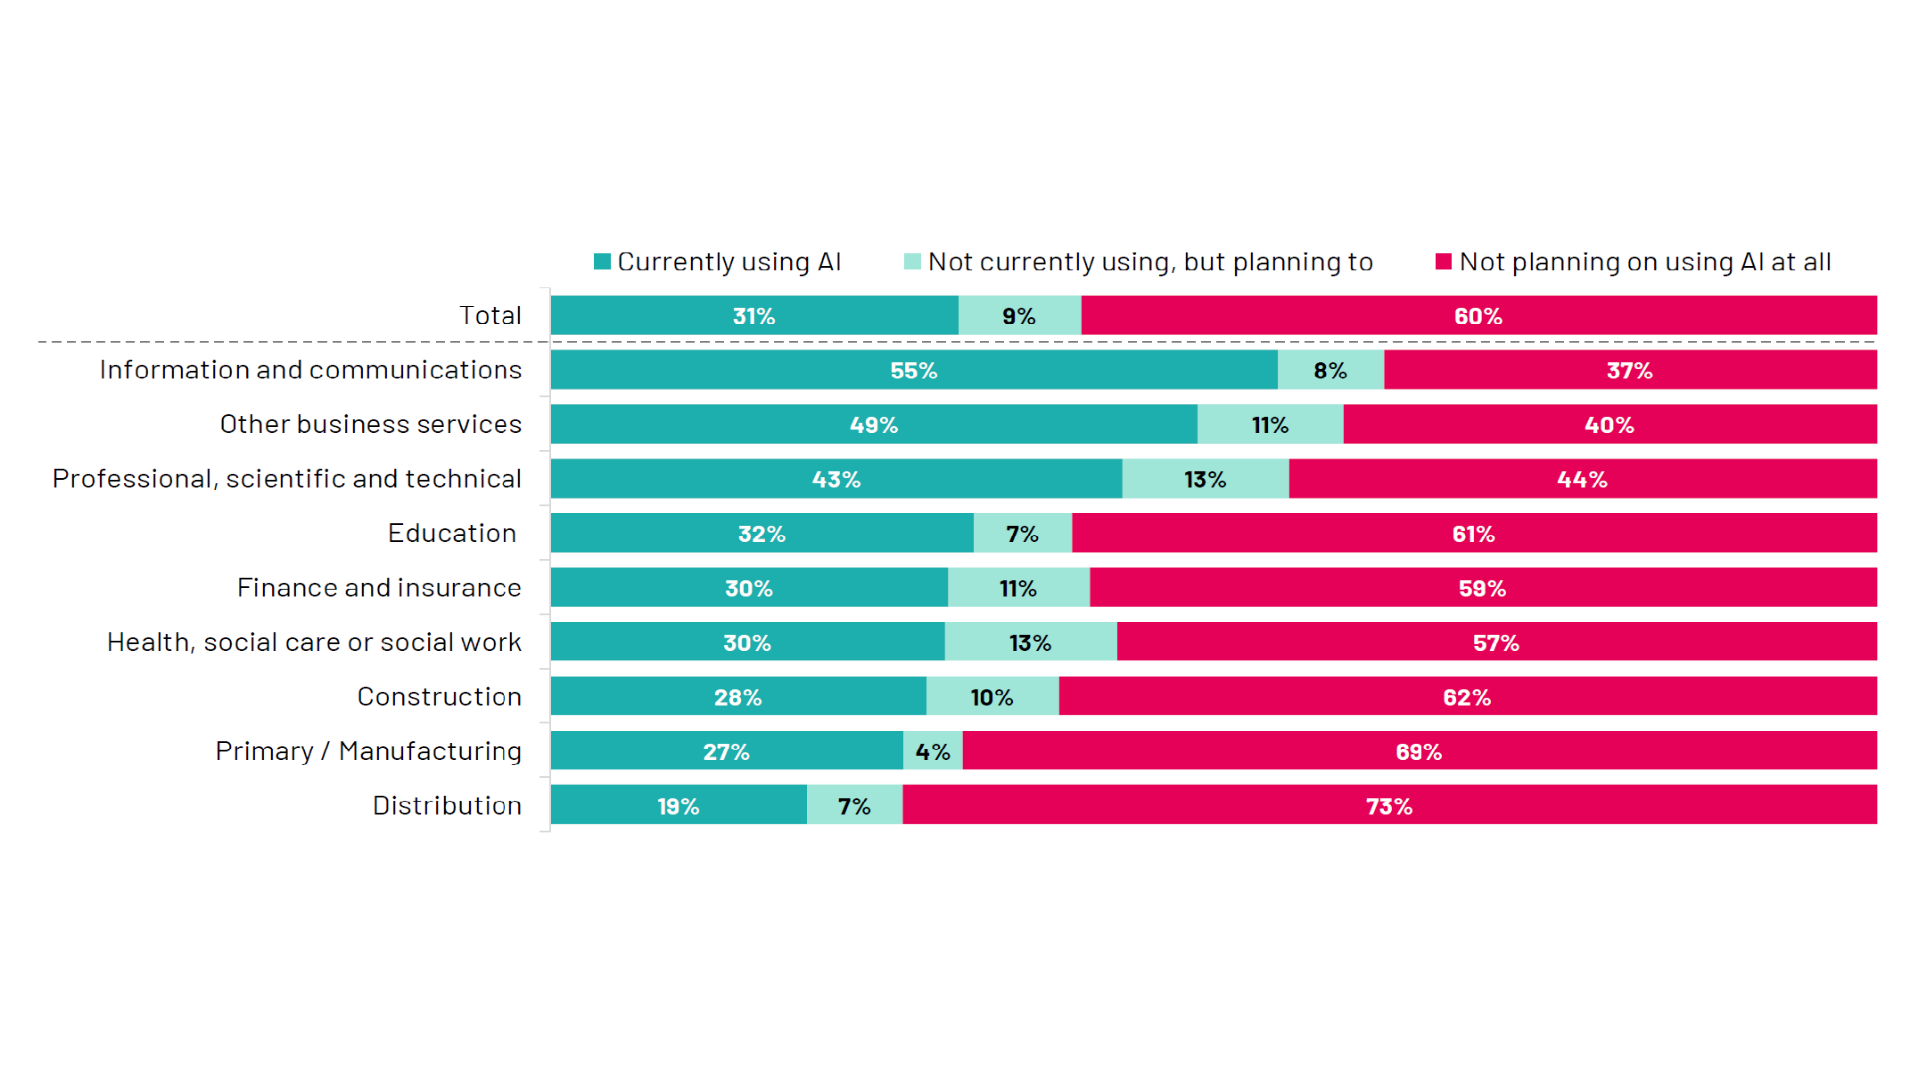
31% of employers currently useĀ AI. 1 in 3 employers are currently usingĀ AI. However, 6 in 10 employers are not usingĀ AIĀ and do not plan to. Figure 3.1 showsĀ AIĀ usage by sector. Information and communications has the highest current usage at 55%. Other business services follow at 49%, and professional, scientific and technical at 43%. Overall, 31% of employers currently useĀ AI, 9% are planning to, and 60% are not planning on usingĀ AIĀ at all.
Figure 3.1: ā€œDo you use or plan to useĀ AIĀ in your business?ā€ survey question responses
Base: All UK employers (n=801); Primary/Manufacturing (n=59); Construction (n=39); Distribution (n=109); Information and communications (n=103); Finance and Insurance (n=128); Professional, scientific and technical (n=92*); Other business services (n=47); Education (n=72); Health, social care or social work (n=125). * small base (sectors with base below 30 are not shown)
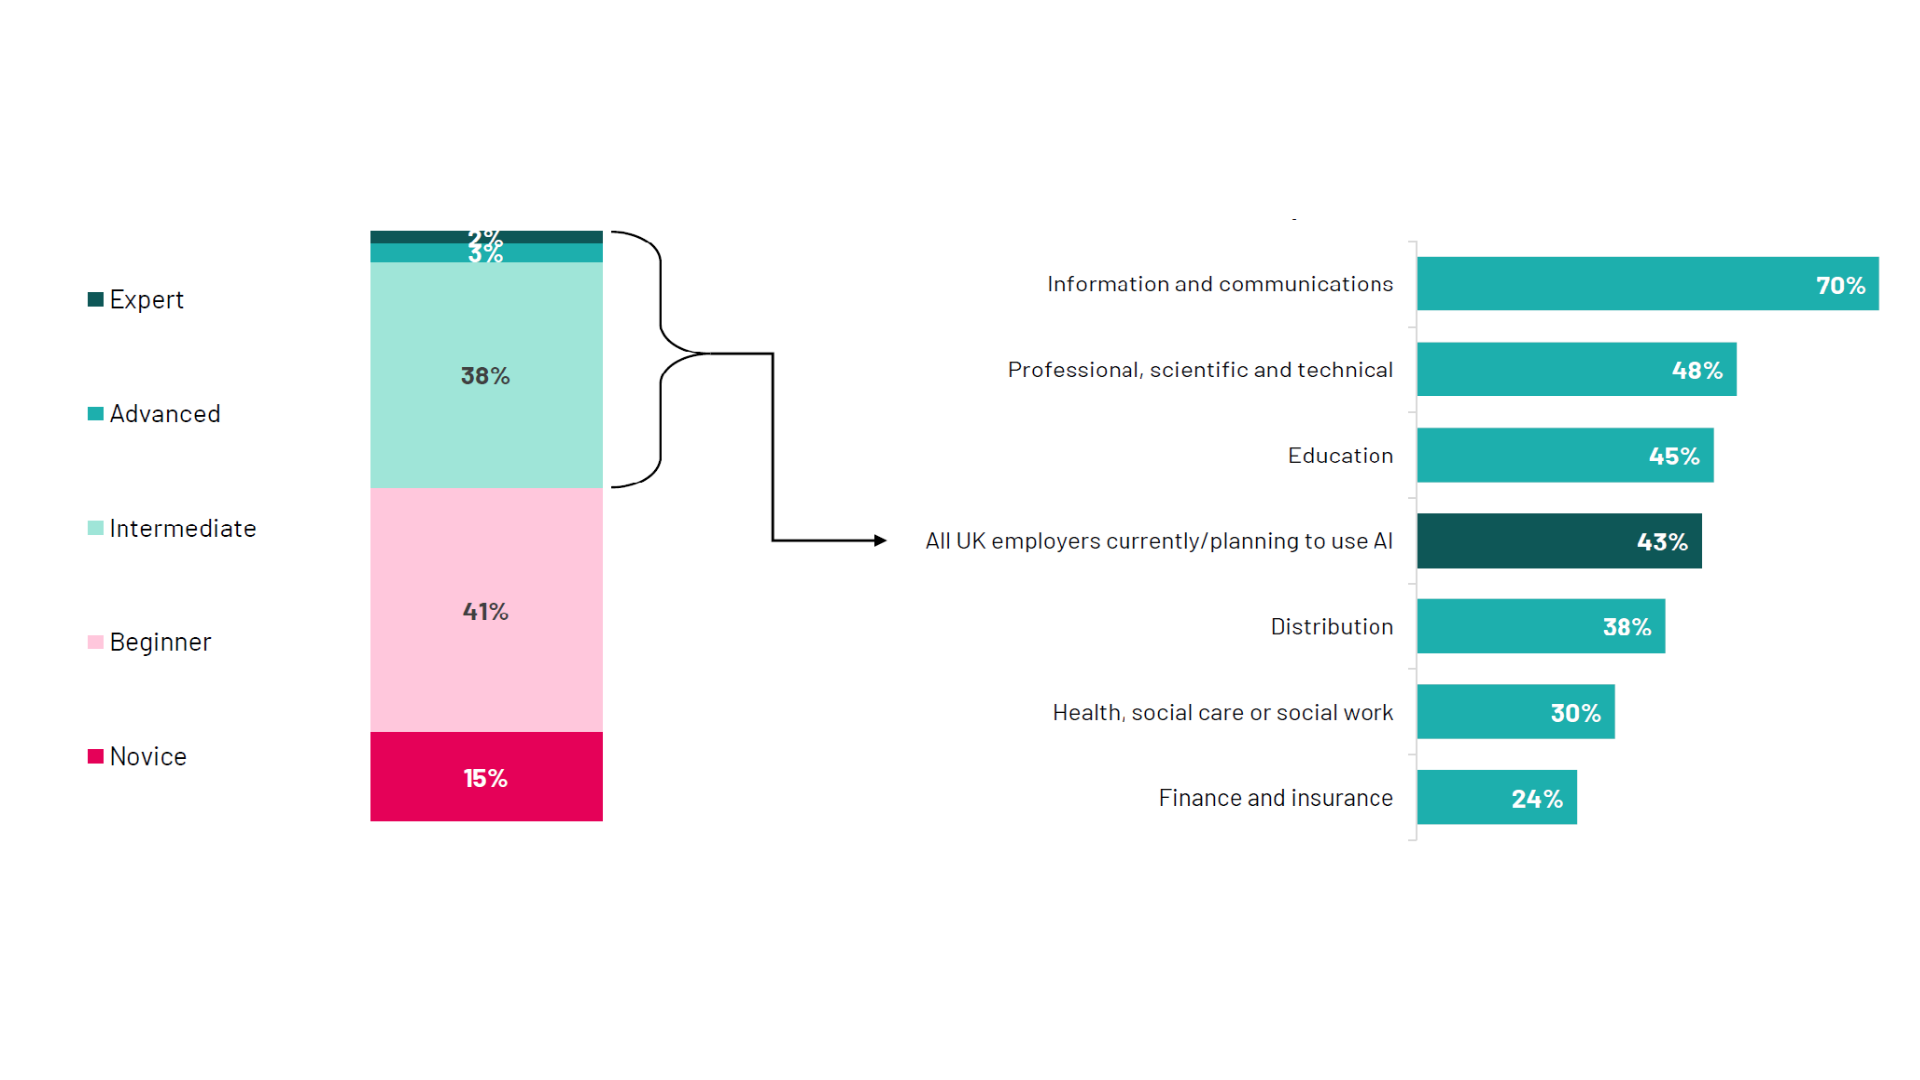
Knowledge levels are mixed ā€“ only a quarter of employers in finance and insurance rate their knowledge ofĀ AIĀ as intermediate or above. Figure 3.2 showsĀ AIĀ knowledge levels. The stacked bar chart on the left shows that among employers who use or plan to useĀ AI, 43% rate their businessā€™ knowledge as intermediate or above, while 56% rate it as beginner or novice. A horizontal bar chart on the right shows that the information and communications sector reports the highest knowledge, with 70% describing the level of knowledge ofĀ AIĀ in their business as intermediate or above, while finance and insurance reports the lowest, at 24%.
Figure 3.2: ā€œHow would you describe the level of knowledge ofĀ AIĀ in your business overall?ā€ survey question responses
Base: All UK employers who use or plan to useĀ AIĢż(²Ō=373); Distribution (n=34); Information and communications (n=65); Finance and Insurance (n=55*); Professional, scientific and technical (n=53); Education (n=34); Health, social care or social work (n=66). * small base (sectors with base below 30 are not shown)
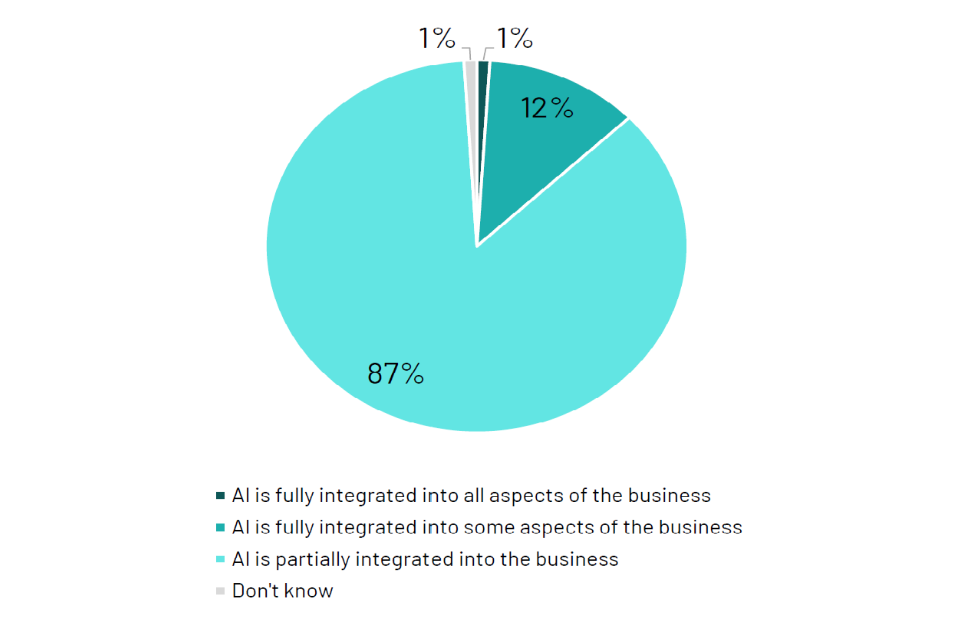
The vast majority ofĀ AI-using employers sayĀ AIĀ is only partially integrated into the business. Figure 3.3 shows the level ofĀ AIĀ integration. 87% of employers usingĀ AIĀ say it is partially integrated into the business. 12% say it is fully integrated into some aspects, and only 1% say it is fully integrated into all aspects of the business.
Figure 3.3: ā€œWhich of the following best describes the current/planned level ofĀ AIĀ implementation in your business overall?ā€ survey question responses
Base: All UK employers who are currently usingĀ AIĢż(²Ō=277)
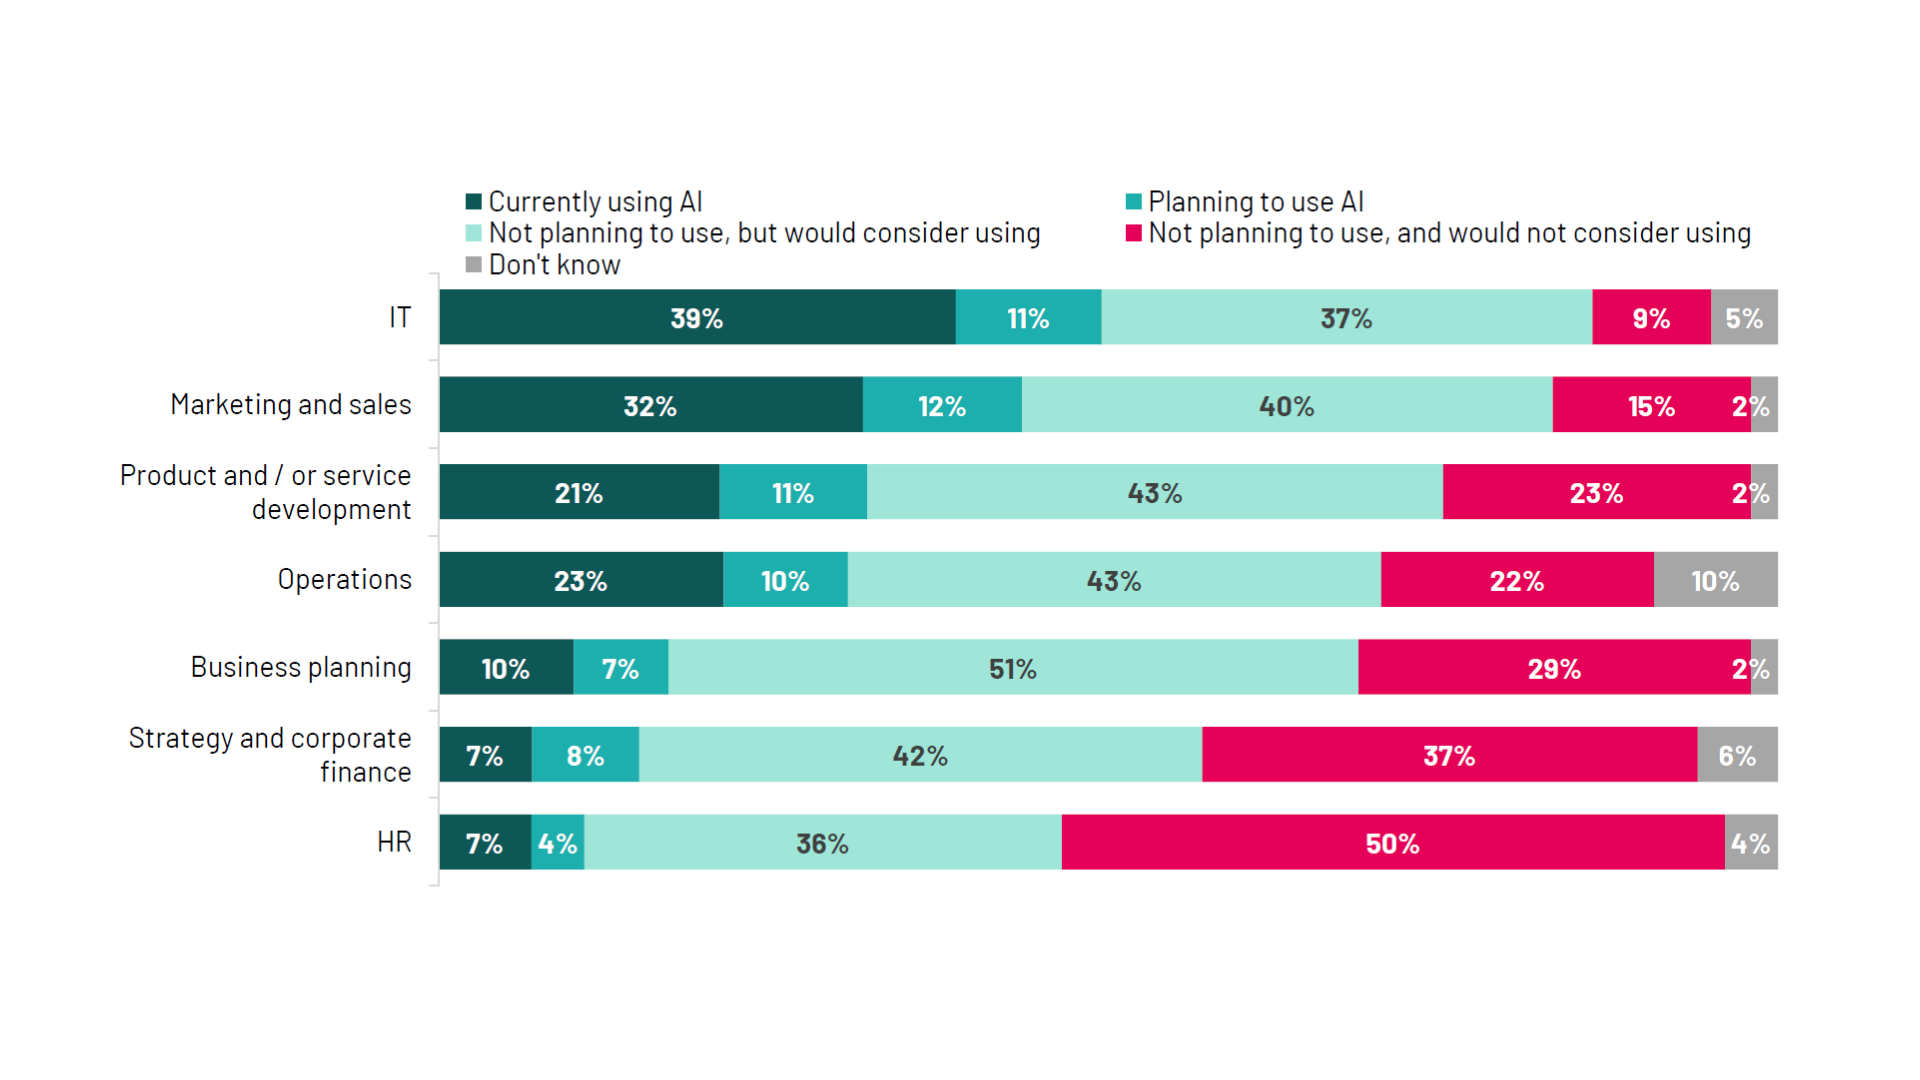
AIĀ does have a range of use cases among employers who use or plan to use it, with IT and marketing and sales being the most common. On average, employers using or planning to useĀ AIĀ do so for 1.39 business functions, demonstrating that most only use it for one singular purpose. Figure 3.4. showsĀ AIĀ use in business functions. IT is the most common function, with 39% currently usingĀ AIĀ for this. This is followed by marketing and sales at 32%. Strategy and corporate finance and HR are the least common functions forĀ AIĀ use, both at 7%.
Figure 3.4: ā€œFor each of the following business functions, can you tell us whether your business is currently usingĀ AI, planning to useĀ AI, or would consider usingĀ AI?ā€ survey question responses
Base: All UK employers who use or plan to useĀ AIĢż(²Ō=373)
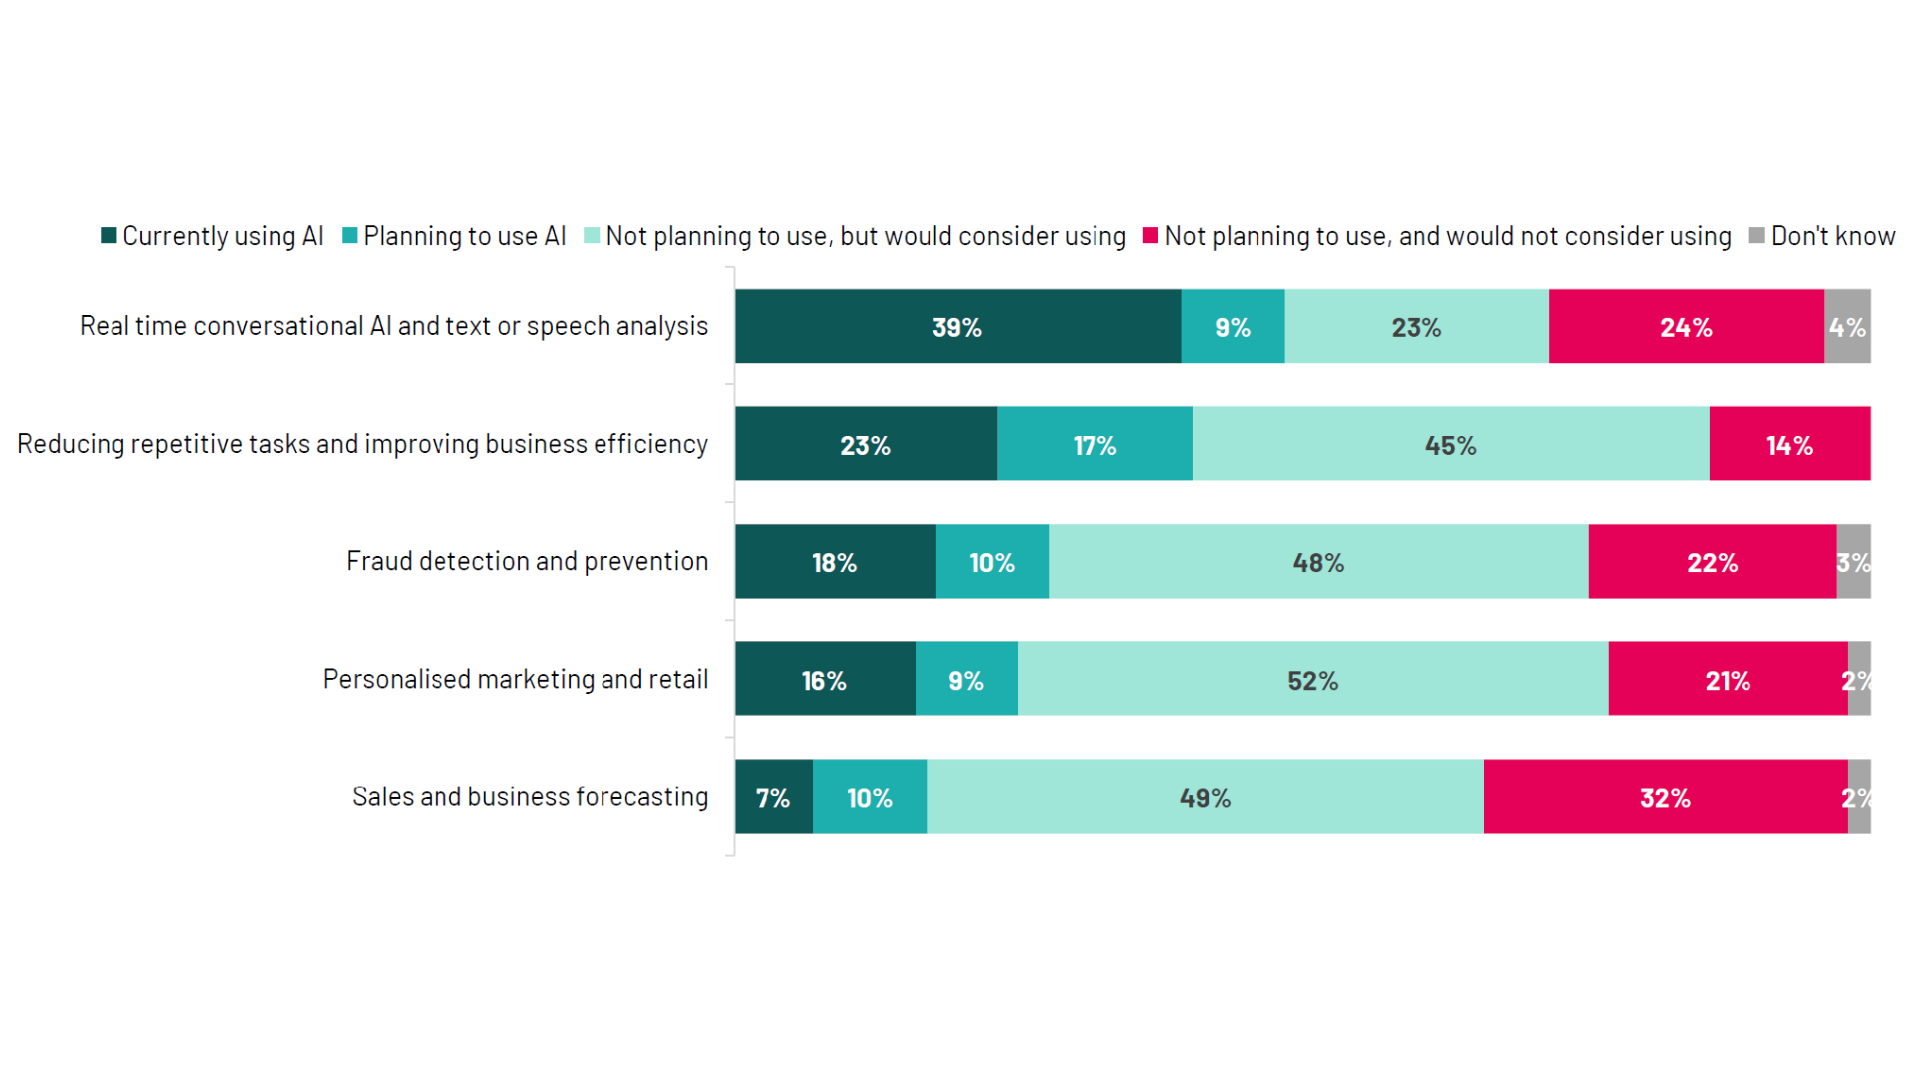
Real-time conversationalĀ AIĀ such as ChatGPT is used most widely of allĀ AIĀ products or services, albeit one in four employers do not consider it. Figure 3.5 showsĀ AI-driven product or service usage among employers who use or plan to useĀ AI. Real-time conversationalĀ AIĀ like ChatGPT is the most widely used product, with 39% of employers currently using it. Reducing repetitive tasks is next at 23%. Sales and business forecasting is the least used at 7%.
Figure 3.5: ā€œFor each of the followingĀ AI-driven products or services, can you tell us whether your business is currently usingĀ AI, planning to useĀ AI, or would consider usingĀ AI?ā€ survey question responses
Base: All UK employers who use or plan to useĀ AIĢż(²Ō=373)
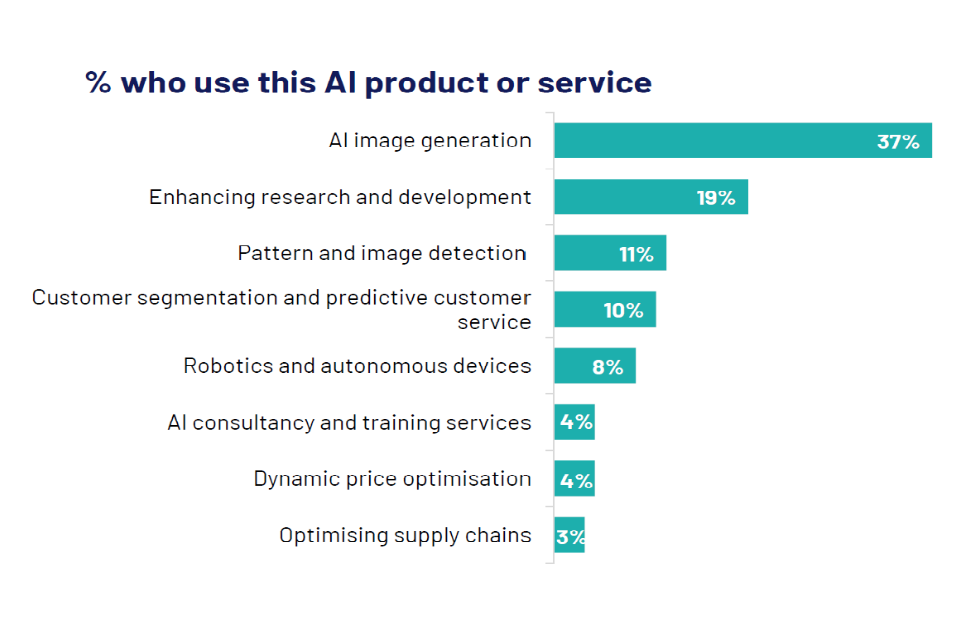
Image generation is the most commonly usedĀ AIĀ product or service. 18% of employers have a self-reportedĀ AIĀ skill level of intermediate or above. Figure 3.6 shows that among businesses with intermediate or higherĀ AIĢż°ģ²Ō“Ē·É±ō±š»å²µ±š,ĢżAIĀ image generation is the most commonly used service at 37%. Enhancing research and development is second at 19%. Optimising supply chains is the least common at 3%.
Figure 3.6: ā€œFor each of the followingĀ AI-driven products or services, can you tell us whether your business is currently usingĀ AI, planning to useĀ AI, or would consider usingĀ AI?ā€ survey question responses
Base: All UK employers whose business has intermediateĀ AIĀ knowledge or above, overall or anywhere in the business (n=193)
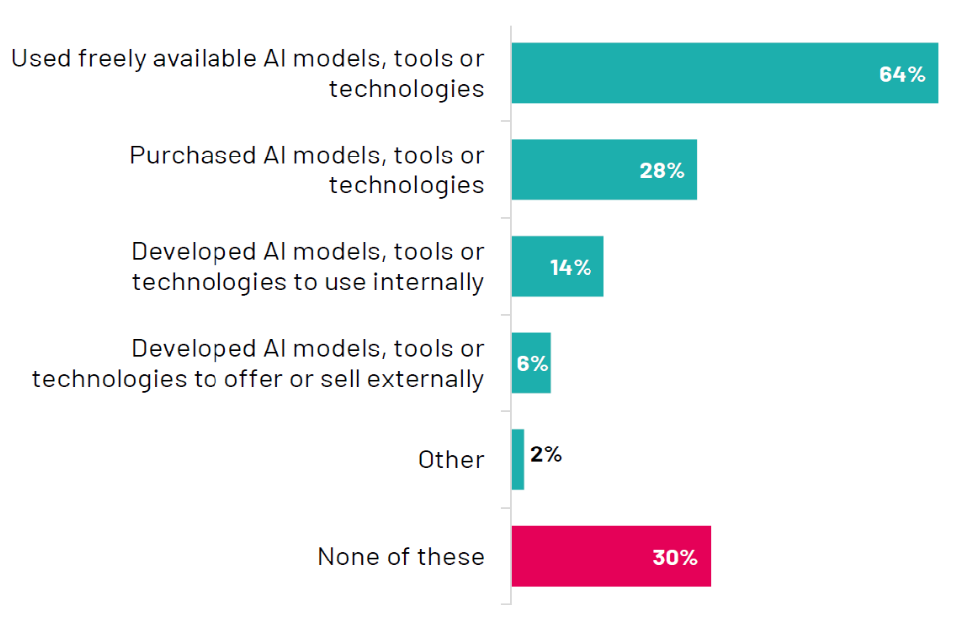
5% of employers currently usingĀ AIĀ say they rely on it, while 94% say they use it but do not rely on it. Two thirds of employers who useĀ AIĀ are using freely available tech. One in four developĀ AIĀ models internally. Figure 3.7 comparesĀ AIĀ activities by knowledge level. 76% of employers with intermediate or higherĀ AIĀ knowledge have used freely availableĀ AIĀ tools, compared to 46% of those with novice or beginner knowledge. Similarly, 21% of the more knowledgeable group have developedĀ AIĀ tools internally, compared to just 3% of the novice group.
Figure 3.7: ā€œWhich of the following has your business done within the last 3 years?ā€ survey question responses
Base: All UK employers who use or plan to useĀ AIĢż(²Ō=292)
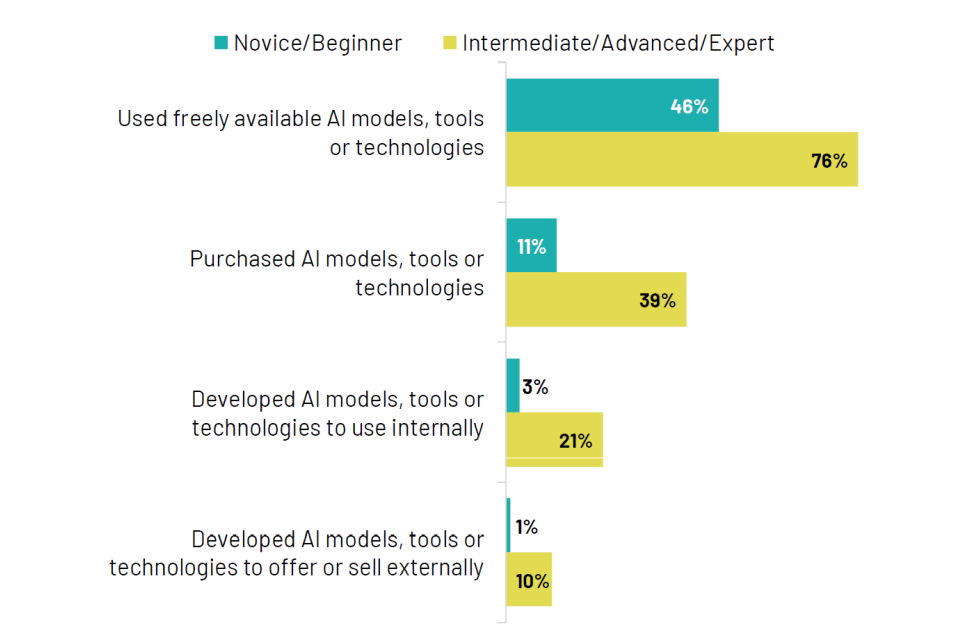
Employers with intermediateĀ AIĀ knowledge or above are more likely than those with novice/beginner knowledge levels to developĀ AIĀ models to use internally or offer or sell externally, as well as use freely available tech. Figure 3.8 comparesĀ AIĀ activities by knowledge level. 76% of employers with intermediate or higherĀ AIĀ knowledge have used freely availableĀ AIĀ tools, compared to 46% of those with novice or beginner knowledge. Similarly, 21% of the more knowledgeable group have developedĀ AIĀ tools internally, compared to just 3% of the novice group.
Figure 3.8: ā€œWhich of the following has your business done within the last 3 years?ā€ survey question responses by knowledge level
4. °ä³Ü°ł°ł±š²Ō³ŁĢżAIĀ skills levels in UK businesses
3 in 10 employers have staff with skills to work with existingĀ AI, and only a minority have technically skilledĀ AIĀ staff. Figure 4.1 illustratesĀ AIĀ skill levels in the workforce. At the bottom, 61% of employers have no staff working withĀ AIĢż(AIĀ non-users). Above that, 28% have staff who use existingĀ AIĀ tools (AIĀ users). The next level shows 5% have staff who can applyĀ AIĀ models (AIĀ implementers). At the top, 5% have staff who can developĀ AIĀ models (AIĢż²õ±č±š³¦¾±²¹±ō¾±²õ³Ł²õ).
Figure 4.1: ā€œDoes your business currently haveā€¦?ā€* survey question responses
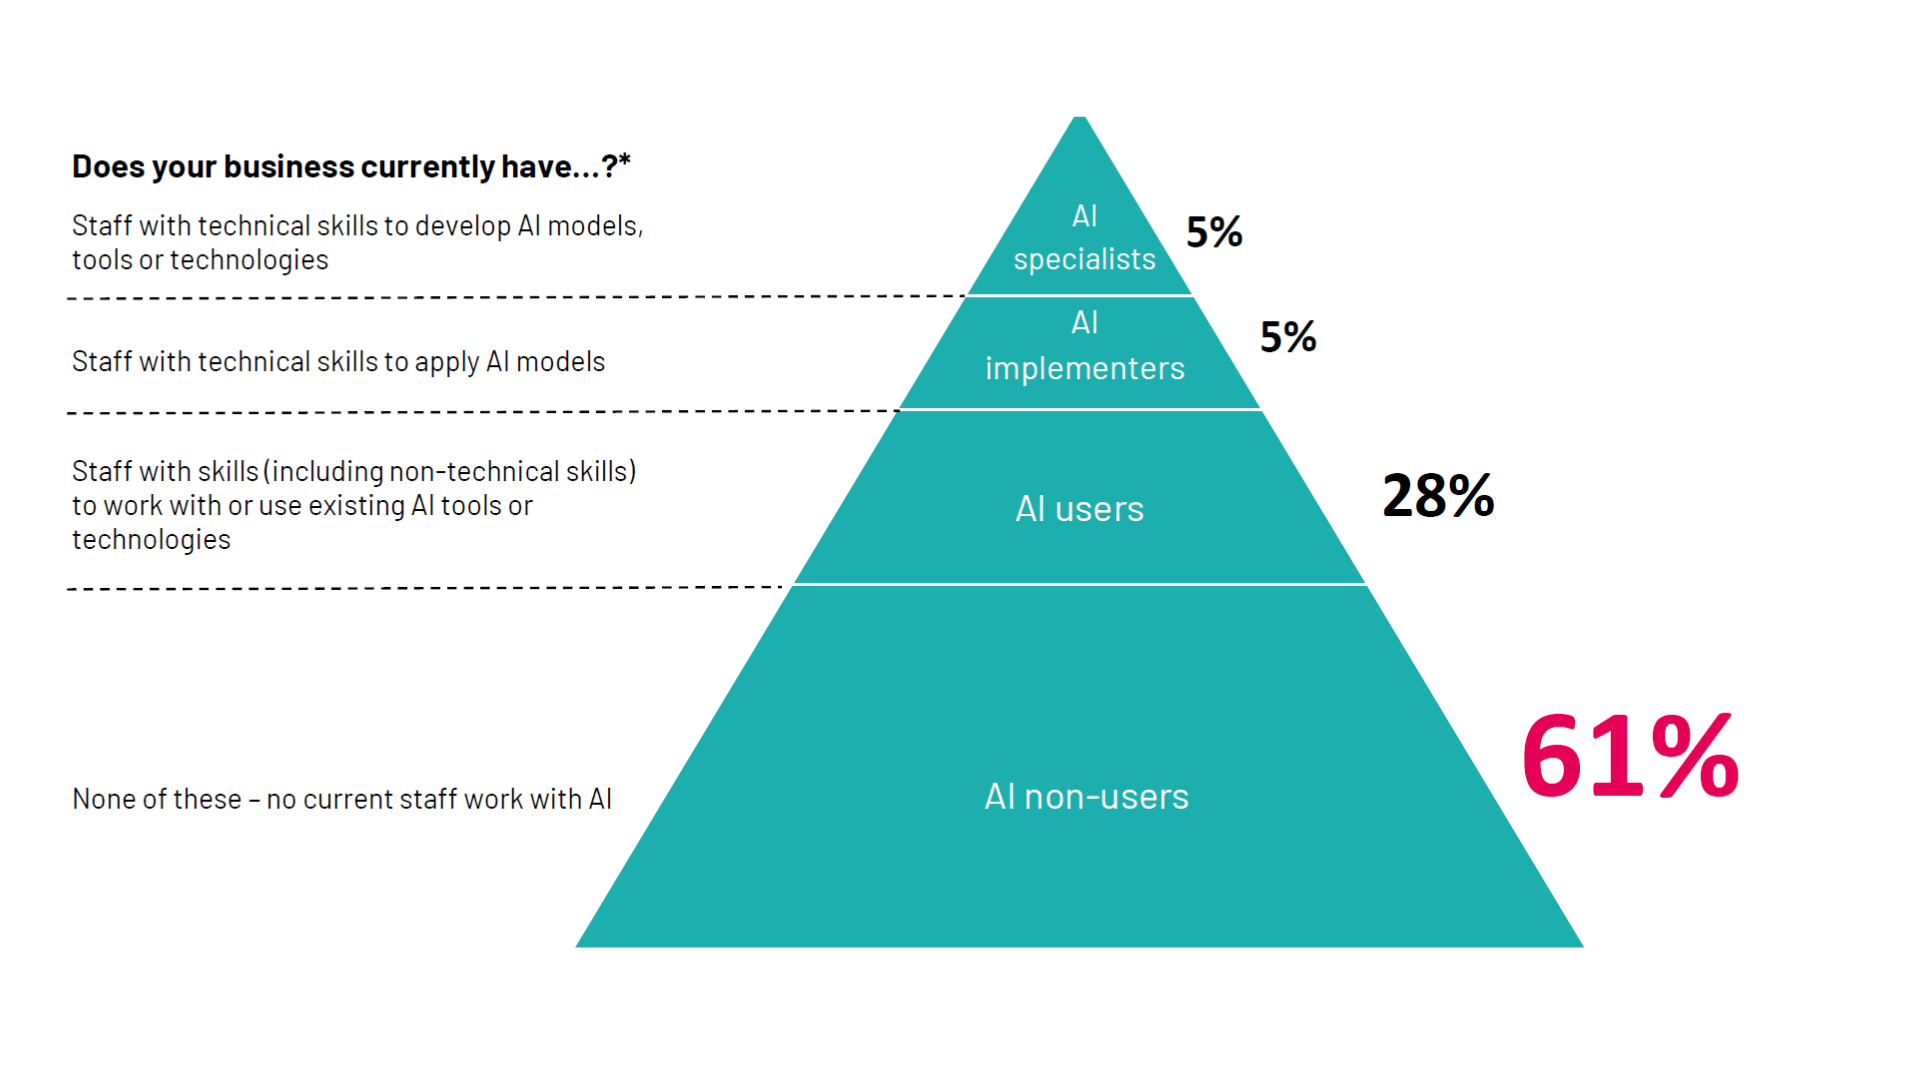
*Some businesses have more than one type of staff working withĀ AIĀ i.e. bothĀ AIĀ specialists andĀ AIĀ implementers. For the purposes of this pyramid, businesses were only counted once, in the category designated for the highest skill level of their staff. Base: All UK employers (n=801)
Education, professional, finance and insurance and other business services have a relatively high proportion ofĀ AIĀ users amongst their staff. Figure 4.2 shows the proportion ofĀ AIĀ skill levels across different sectors. The information and communications sector has a high proportion ofĀ AIĀ specialists at 20%, compared to the 5% average. The other business services sector has a high proportion ofĀ AIĀ users at 39%. Distribution has the highest proportion ofĀ AIĀ non-users at 74%.
Figure 4.2: Proportion of employers with staff who areĀ AIĢż²õ±č±š³¦¾±²¹±ō¾±²õ³Ł²õ,ĢżAIĢż¾±³¾±č±ō±š³¾±š²Ō³Ł±š°ł²õ,ĢżAIĀ users orĀ AIĀ non-users, overall and by sector*
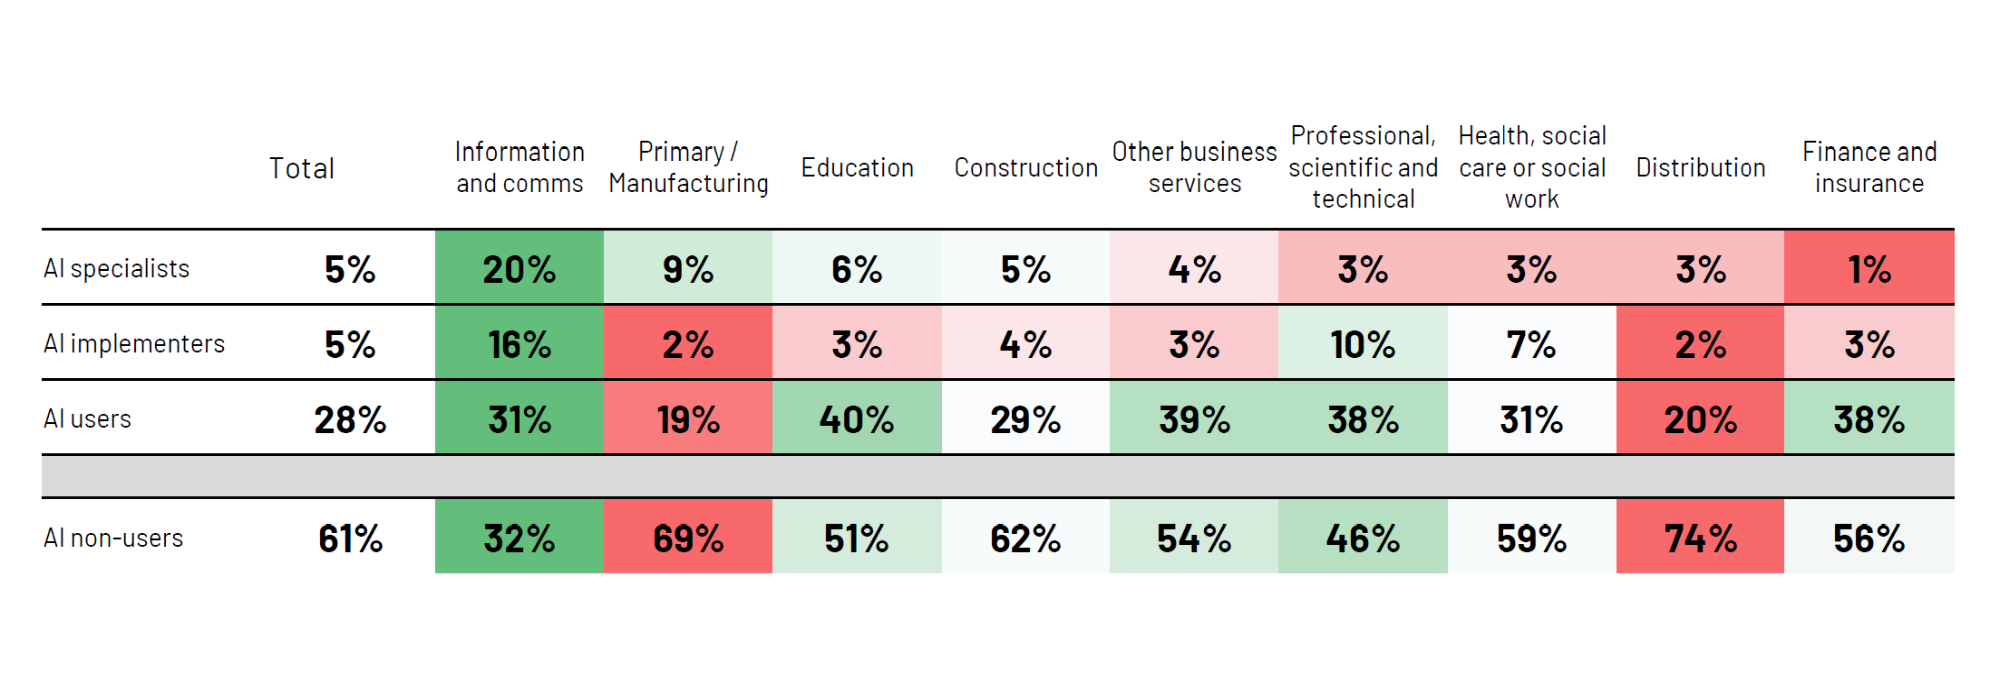
*Shading indicates a higher or lower proportion of staff than average for that role in that sector, with green denoting a higher proportion than average, and red denoting a lower proportion than average, aside from non-users, where the colours represent the reverse
Base: All UK employers (n=801); Primary/Manufacturing (n=59); Construction (n=39); Distribution (n=109); Information and communications (n=103); Finance and Insurance (n=128); Professional, scientific and technical (n=92*); Other business services (n=47); Education (n=72); Health, social care or social work (n=125). * small base (sectors with base below 30 are not shown)
28% of employers with staff that work withĀ AIĀ say that at least three quarters of their workforce have usedĀ AIĀ in the past 3 years. 37% of employers have staff that work withĀ AIĢż(either specialists, implementers, or users). Figure 4.3 shows that amongst employers with staff that work withĀ AI, 28% say that more than three-quarters of their workforce have usedĀ AIĀ in the past 3 years. 26% say between 25% and 75% of their workforce have used it.
Figure 4.3: Proportion of employees who have usedĀ AIĀ tech in the past 3 years
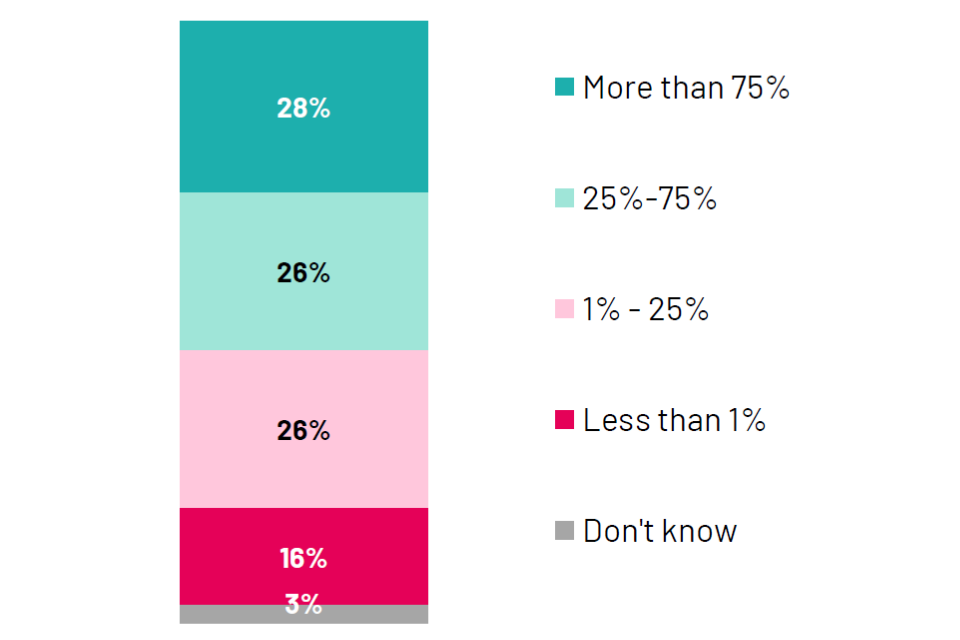
Base: All UK employers with technical or non-technical staff working withĀ AIĢż(n=360)
51% of employers with technical staff working withĀ AIĀ rate their businessā€™ technicalĀ AIĀ capacity as fairly or very good. 10% of employers have staff who areĀ AIĀ specialists or implementers. Figure 4.4 shows that 51% of employers with technicalĀ AIĀ staff rate their businessā€™s technical capacity to develop or maintainĀ AIĢż²õ²ā²õ³Ł±š³¾²õ as either ā€˜fairly goodā€™ (35%) or ā€˜very goodā€™ (16%).
Figure 4.4: Rating of businessā€™ technical capacity to develop or maintainĀ AIĢż²õ²ā²õ³Ł±š³¾²õ
Base: All UK employers with technical staff working withĀ AIĢż(n=113)
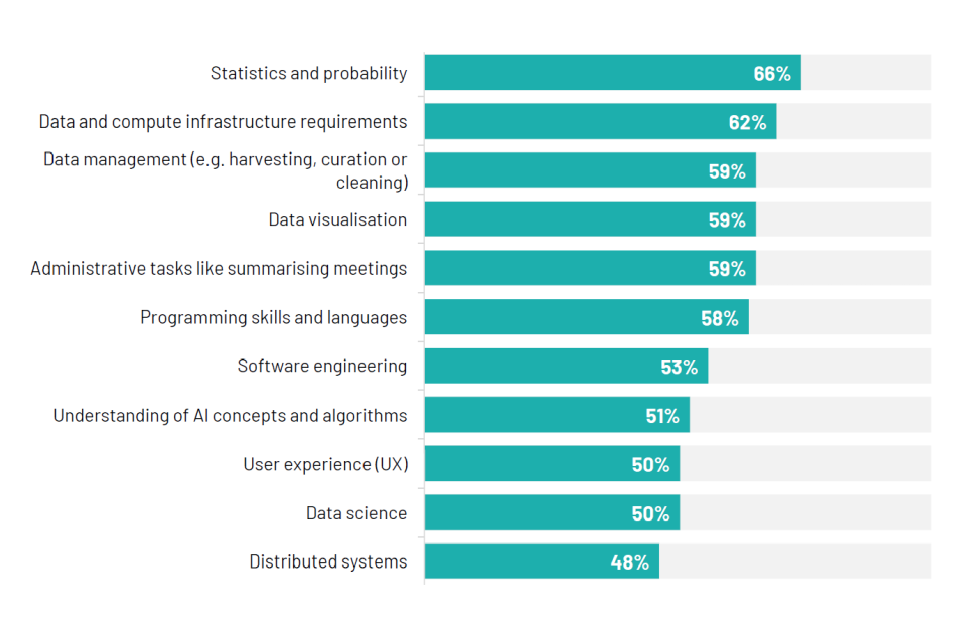
Among employers with technicalĀ AIĀ staff, statistics and data infrastructure skills are the most highly rated technical staff skills. Figure 4.5 shows ratings of technicalĀ AIĀ staff skills. Statistics and probability is the most highly rated skill, with 66% of employers rating their staff as ā€˜goodā€™ at this. Data and compute infrastructure requirements are rated as ā€˜goodā€™ by 62%. Distributed systems is the lowest-rated skill at 48%.
Figure 4.5: Rating of staffā€™s technicalĀ AIĀ skills - % good
Base: All UK employers with technical staff working withĀ AIĢż(n=113)
61% of employers with staff that useĀ AIĀ are satisfied with their staffā€™sā€™ ability to keep their information safe and private when usingĀ AI. Figure 4.6 is a horizontal bar chart rating non-technicalĀ AIĀ skills. 61% of employers withĀ AI-using staff rate their staffā€™s ability to keep information safe and private as ā€˜goodā€™. 60% rate their ability to communicate withĀ AIĢż²õ²ā²õ³Ł±š³¾²õ as ā€˜goodā€™, followed by understanding the risks and threats associated with usingĀ AIĢż²õ²ā²õ³Ł±š³¾²õ (59%) and being able to judge the accuracy and reliability of information provided byĀ AIĢż²õ²ā²õ³Ł±š³¾²õ (57%). The ability to write clear prompts for generativeĀ AIĀ is rated ā€˜goodā€™ by 45%.
Figure 4.6: ā€œHow would you rate the staff with technical or non-technicalĀ AIĀ skills across the following areas? % goodā€ survey question responses

Base: All UK employers with technical or non-technical staff working withĀ AIĢż(n=348)
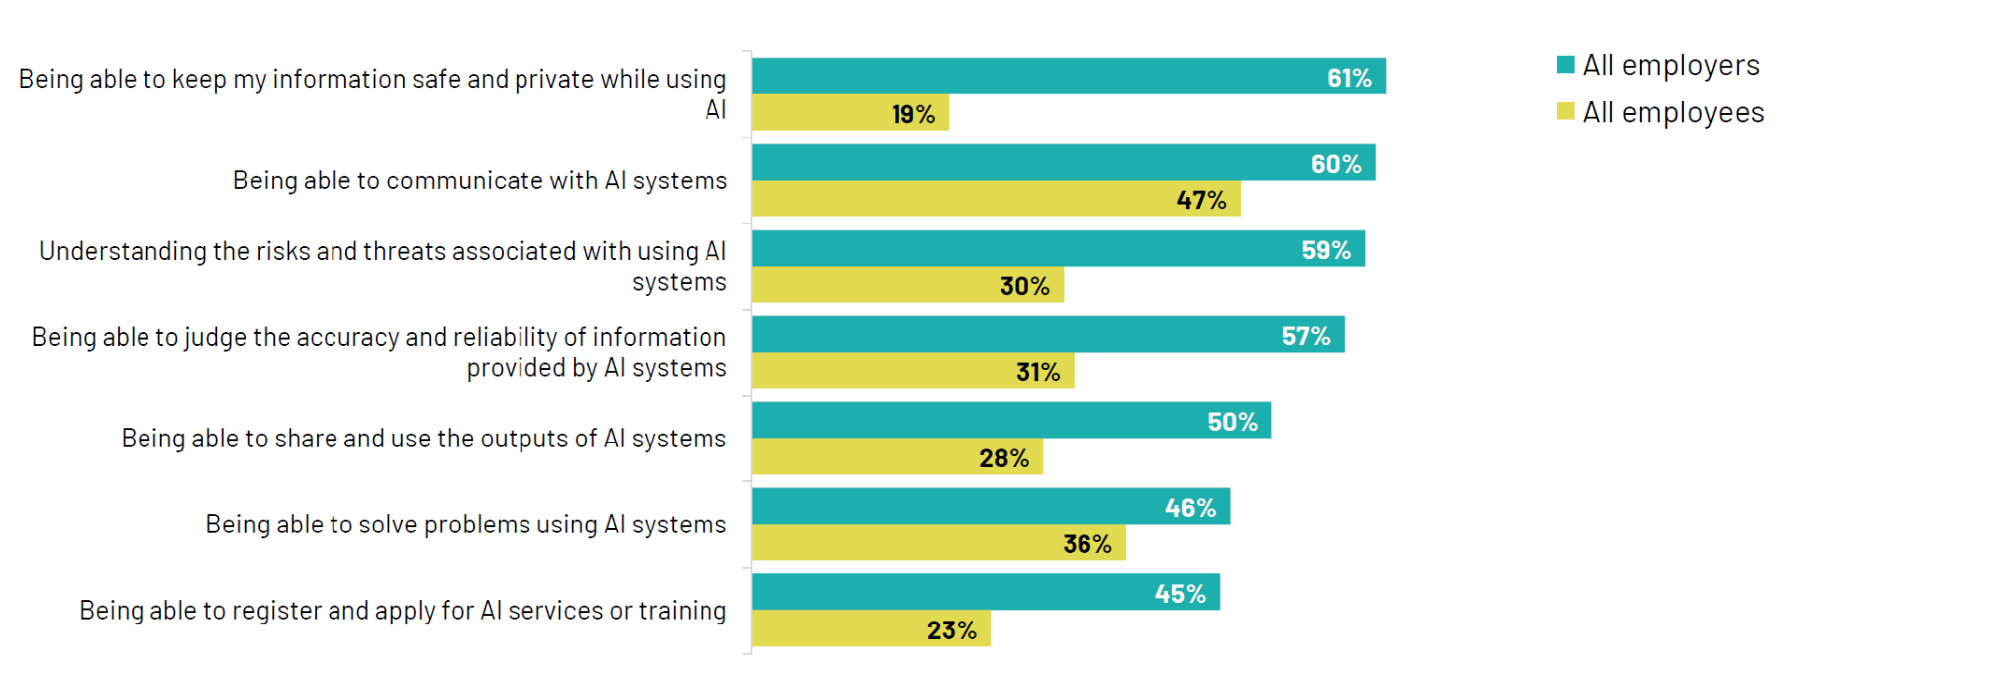
However, it is evident that employers think their staff are much better at understanding privacy than the workers themselves think they are. Note that the general public survey was a different study undertaken as part of the wider project, so the results should be understood as indicative of trends or differences between employers and workers, rather than being directly comparable. Figure 4.7 compares employer ratings of staff skills with employee self-reported confidence. Employers rate staff skills much higher than employees rate their own confidence. For example, 61% of employers rate staff as ā€˜goodā€™ at keeping information safe, while only 19% of employees feel confident in this skill.
Figure 4.7: ā€œHow would you rate the staff with technical or non-technicalĀ AIĀ skills across the following areas? % goodā€ compared with ā€œHow confident do you feel in your ability to use these skills in your day-to-day life? % confidentā€ survey question responses
Base for employers survey: All UK employers with technical or non-technical staff working withĀ AIĢż(n=348). Base for general public survey: All who have heard ofĀ AIĀ who work full time (n=417)
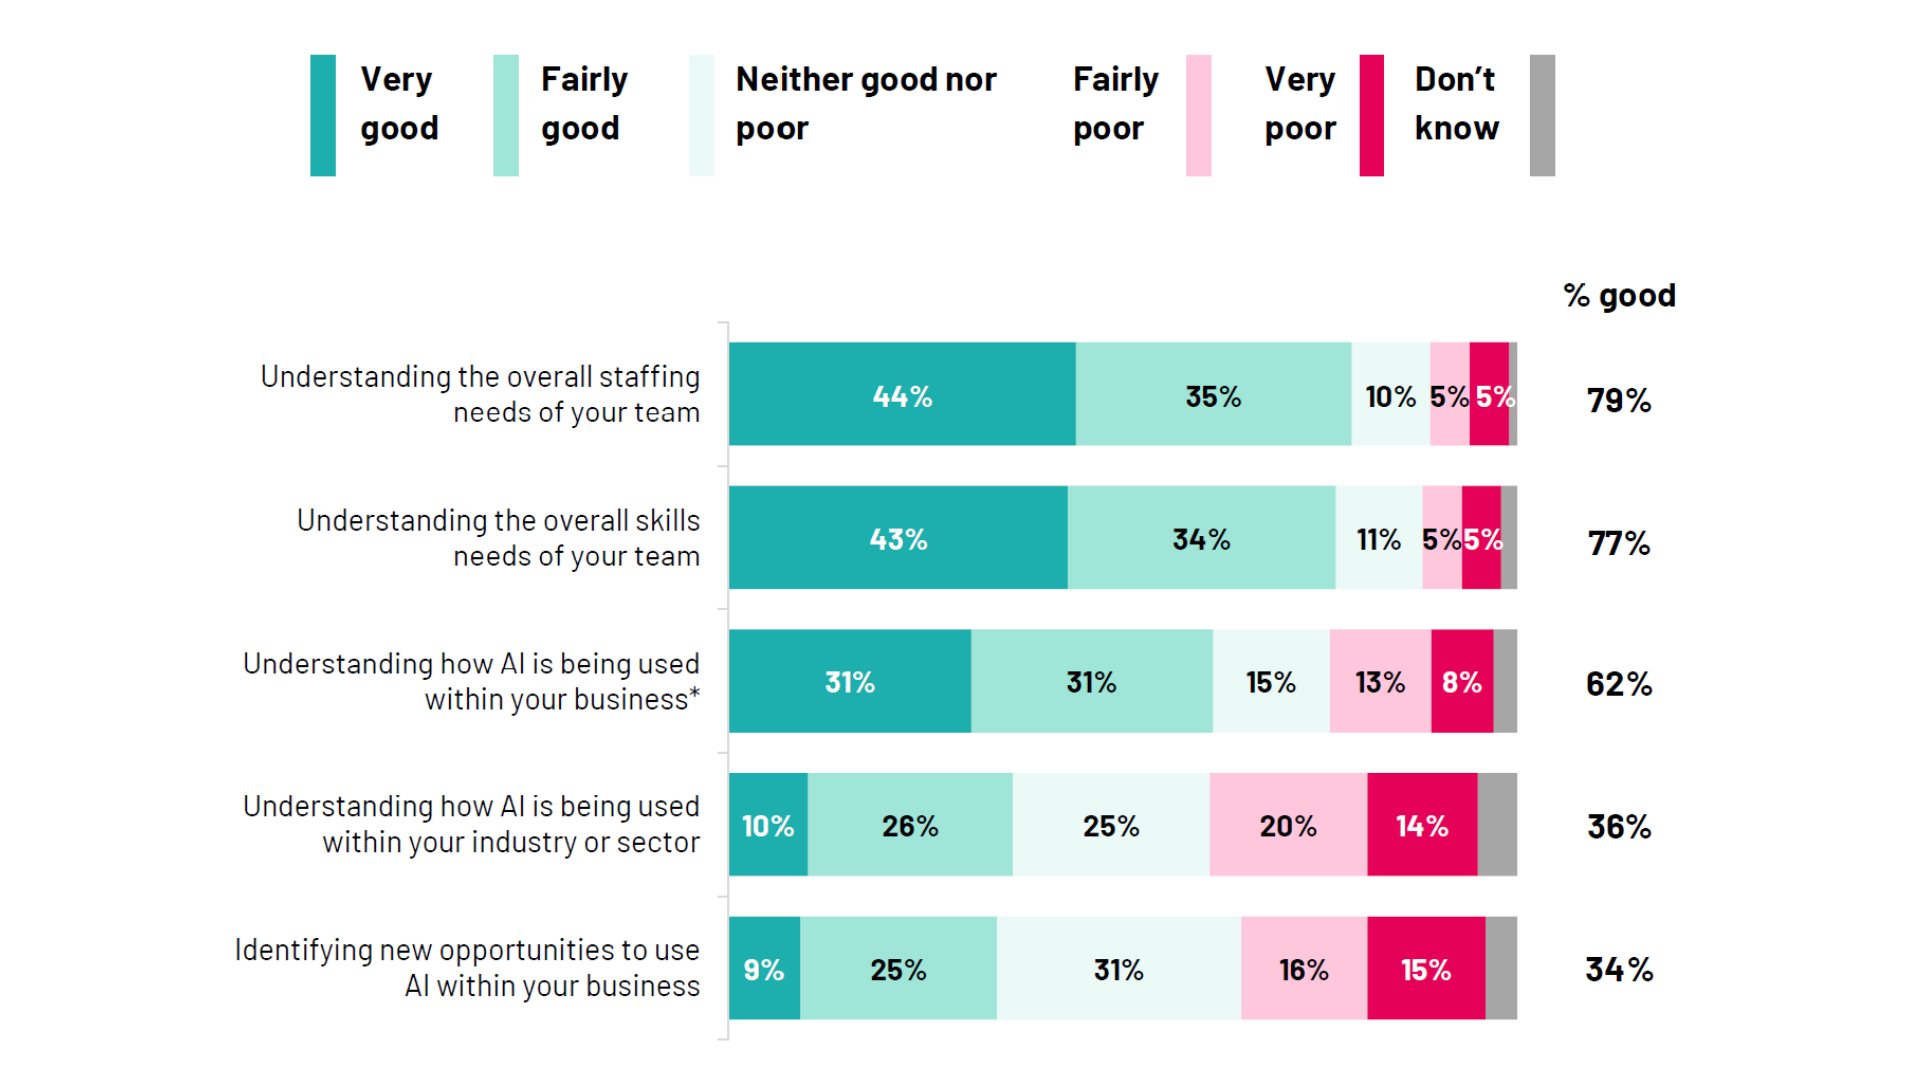
According to employers, senior leadership teams have a good understanding of overall skills and staffing, but not of new opportunities forĀ AIĀ in their sector. Figure 4.8 shows employer ratings of their senior leadershipā€™s understanding ofĀ AI. 79% rate their understanding of overall staffing needs as ā€˜goodā€™. However, only 36% rate their understanding of howĀ AIĀ is used in their industry as ā€˜goodā€™, and only 34% rate their ability to identify new opportunities forĀ AIĀ as ā€˜goodā€™.
Figure 4.8: ā€œHow would you rate your businessā€™ technical capacity to develop or maintainĀ AIĢż²õ²ā²õ³Ł±š³¾²õ?ā€ survey question responses
Base: All UK employers (n=801). * Only asked to UK employers who are currently usingĀ AIĢż(²Ō=277)
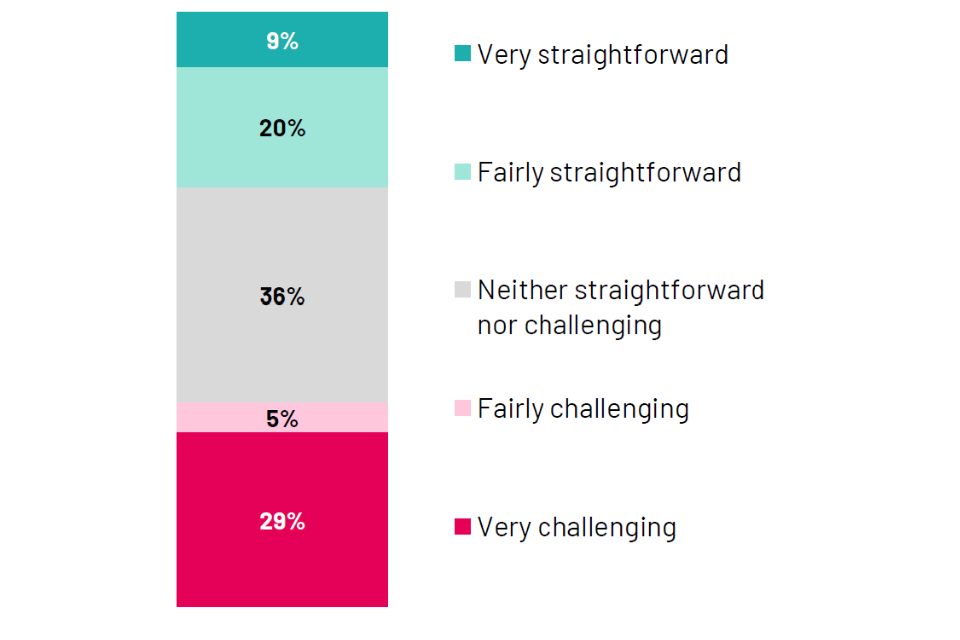
4% have tried to recruit at least one person to work withĀ AIĀ models, tools or technologies in the last 3 years. Of the 4% who have recruitedĀ AIĀ users, 1 in 3 of them found it challenging because of the lack of suitable candidates. Figure 4.9 shows that of the 4% who have recruited, 34% found it challenging. The horizontal bar chart on the right shows that for those who found recruitment challenging, 91% cited a lack of suitable candidates and a lack of technical skills as the main reasons. However, this should be treated with caution due to the very small base.
Figure 4.9: ā€œHow did you find the recruitment methods for finding candidates for such roles?ā€ survey question responses
Base: All UK employers who tried to recruit in last 3 years (n=38*). * small base
5. FutureĀ AIĀ skills for UK businesses
Almost half of employers expect their business model will rely on, or at least use,Ā AIĀ in the next 3 to 5 years. Figure 5.1 shows that in the next 3 to 5 years, 45% of employers expect to use or rely onĀ AI. This expectation is highest in ā€˜Other business servicesā€™ (68%) and ā€˜Information and communicationsā€™ (67%), and lowest in ā€˜Distributionā€™ (31%).
Figure 5.1: ā€œAnd thinking about your business model 3 to 5 years from now, which of the following statements is most accurate?ā€ survey question responses
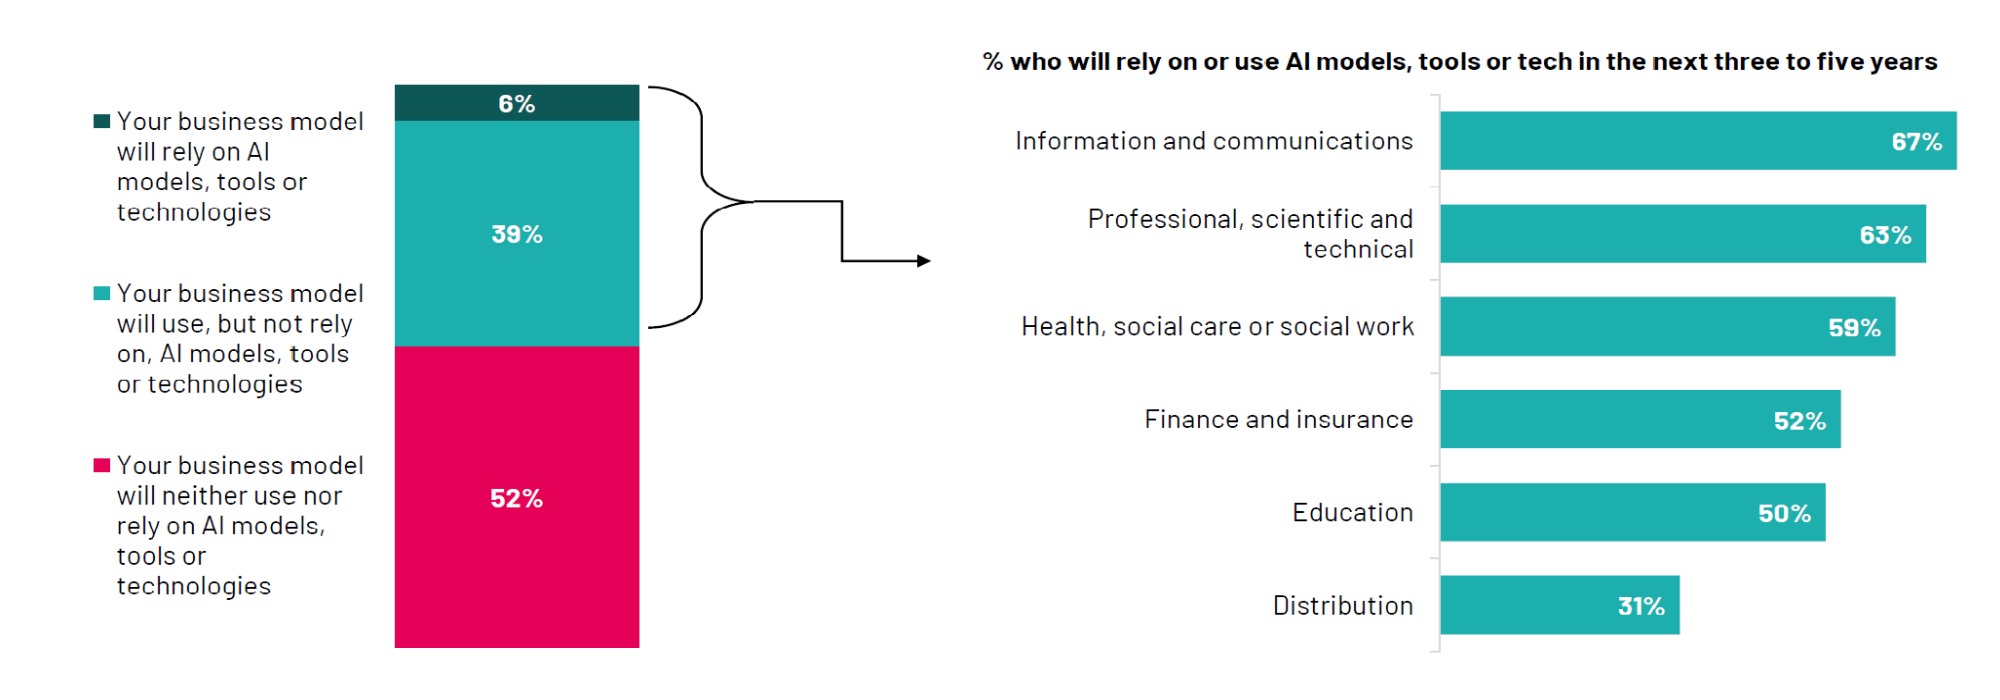
Base: All UK employers who use or plan to useĀ AIĢż(²Ō=373); Distribution (n=34); Information and communications (n=65); Finance and Insurance (n=55*); Professional, scientific and technical (n=53); Education (n=34); Health, social care or social work (n=66). * small base (sectors with base below 30 are not shown)
Employers plan to useĀ AIĀ to reduce repetitive tasks and improve business efficiency, across a variety of business functions. Figure 5.2 shows IT and marketing are the top functions for actual or plannedĀ AIĢż³Ü²õ±š.
Figure 5.2: ā€œCan you tell us whether your business is currently usingĀ AI, planning to useĀ AI, or would consider usingĀ AIĀ for the followingā€¦ā€ survey question responses
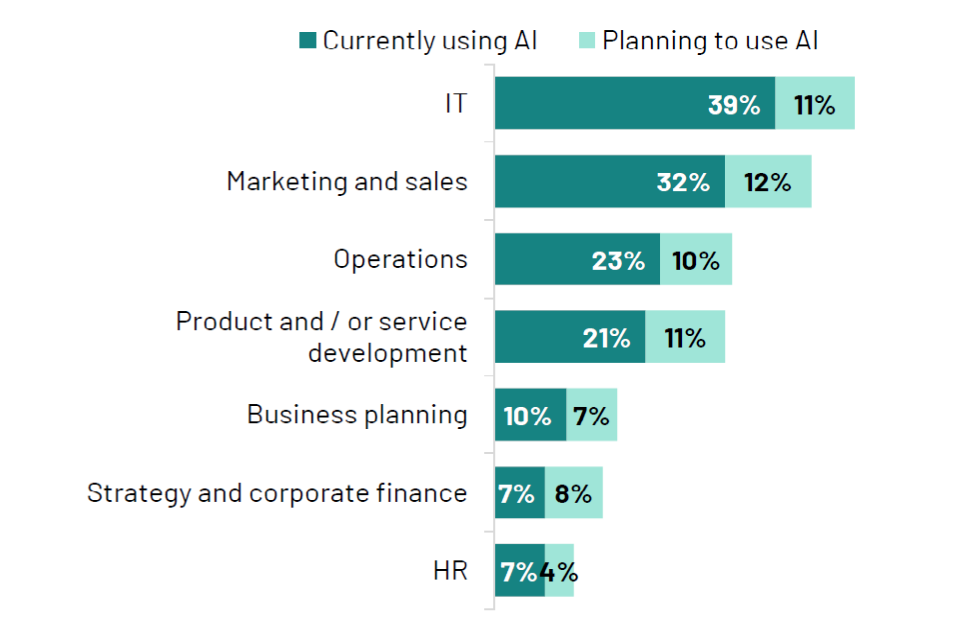
Base: All UK employers who use or plan to useĀ AIĢż(²Ō=373)
Figure 5.3 shows that reducing repetitive tasks and using conversationalĀ AIĀ are the top current or planned applications forĀ AI.
Figure 5.3: ā€œCan you tell us whether your business is currently usingĀ AI, planning to useĀ AI, or would consider usingĀ AIĀ for the followingā€¦ā€ survey question responses
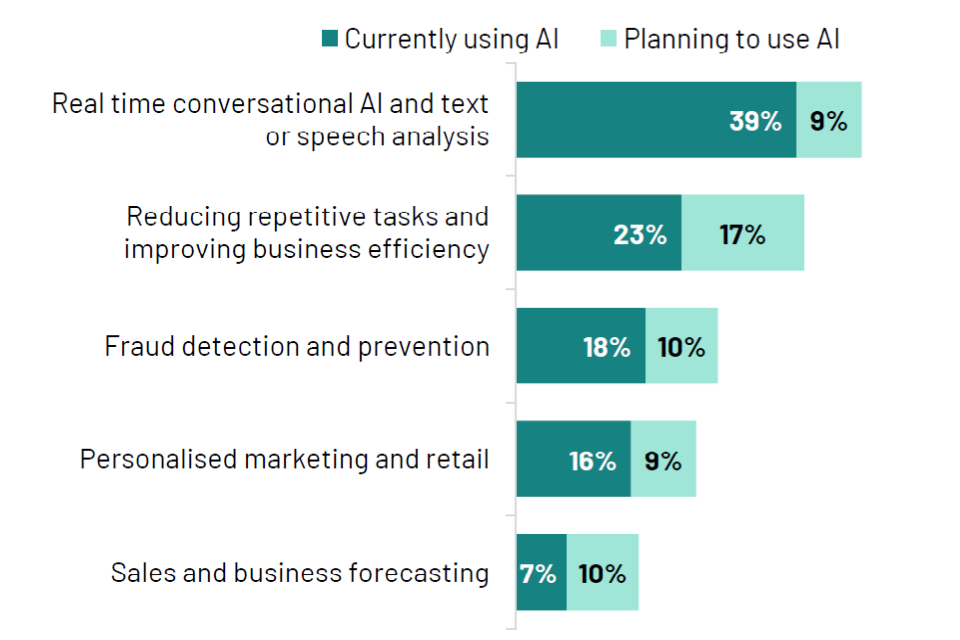
Base: All UK employers who use or plan to useĀ AIĢż(²Ō=373)
21% say their demand forĀ AIĀ skills is likely to increase over the next 12 months. A quarter of employers believe that a lack ofĀ AIĀ staff affected their businessesā€™ ability to meet business goals across the last 3 years. Figure 5.4 shows that 25% of employers believe a lack ofĀ AIĀ specialists among current staff has affected their ability to meet business goals to some or a great extent. 27% say the same for a lack ofĀ AIĀ implementers andĀ AIĀ users. When speaking about candidates, the corresponding figures are lower.
Figure 5.4: ā€œTo what extent, if at all, have any of the following issues affected your ability to meet your business goals across the last 3 years?ā€ % To some or a great extent
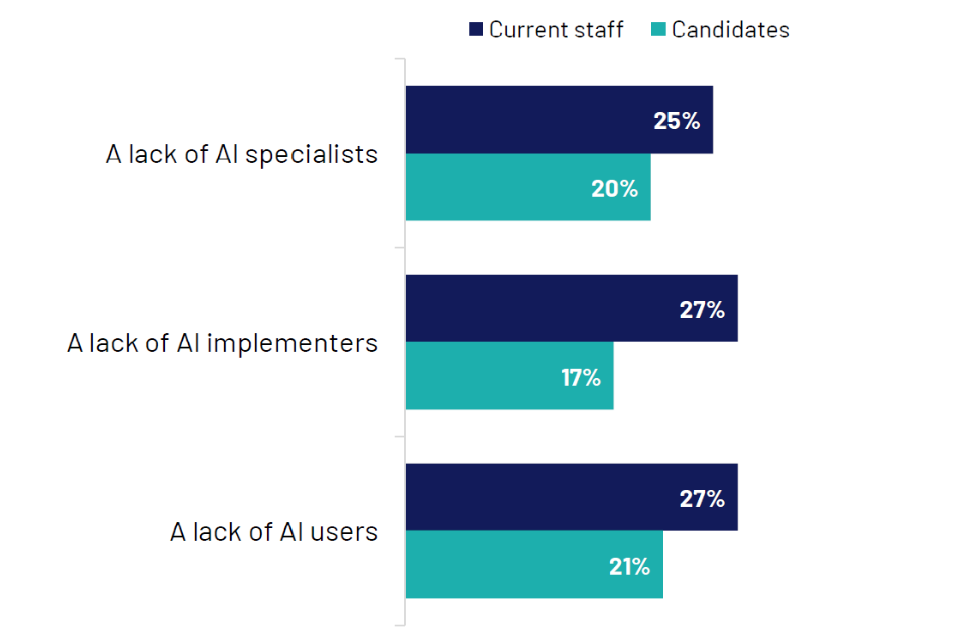
Base: All UK employers who use or plan to useĀ AI, excluding those who say ā€˜not applicableā€™ (n=314 to 354)
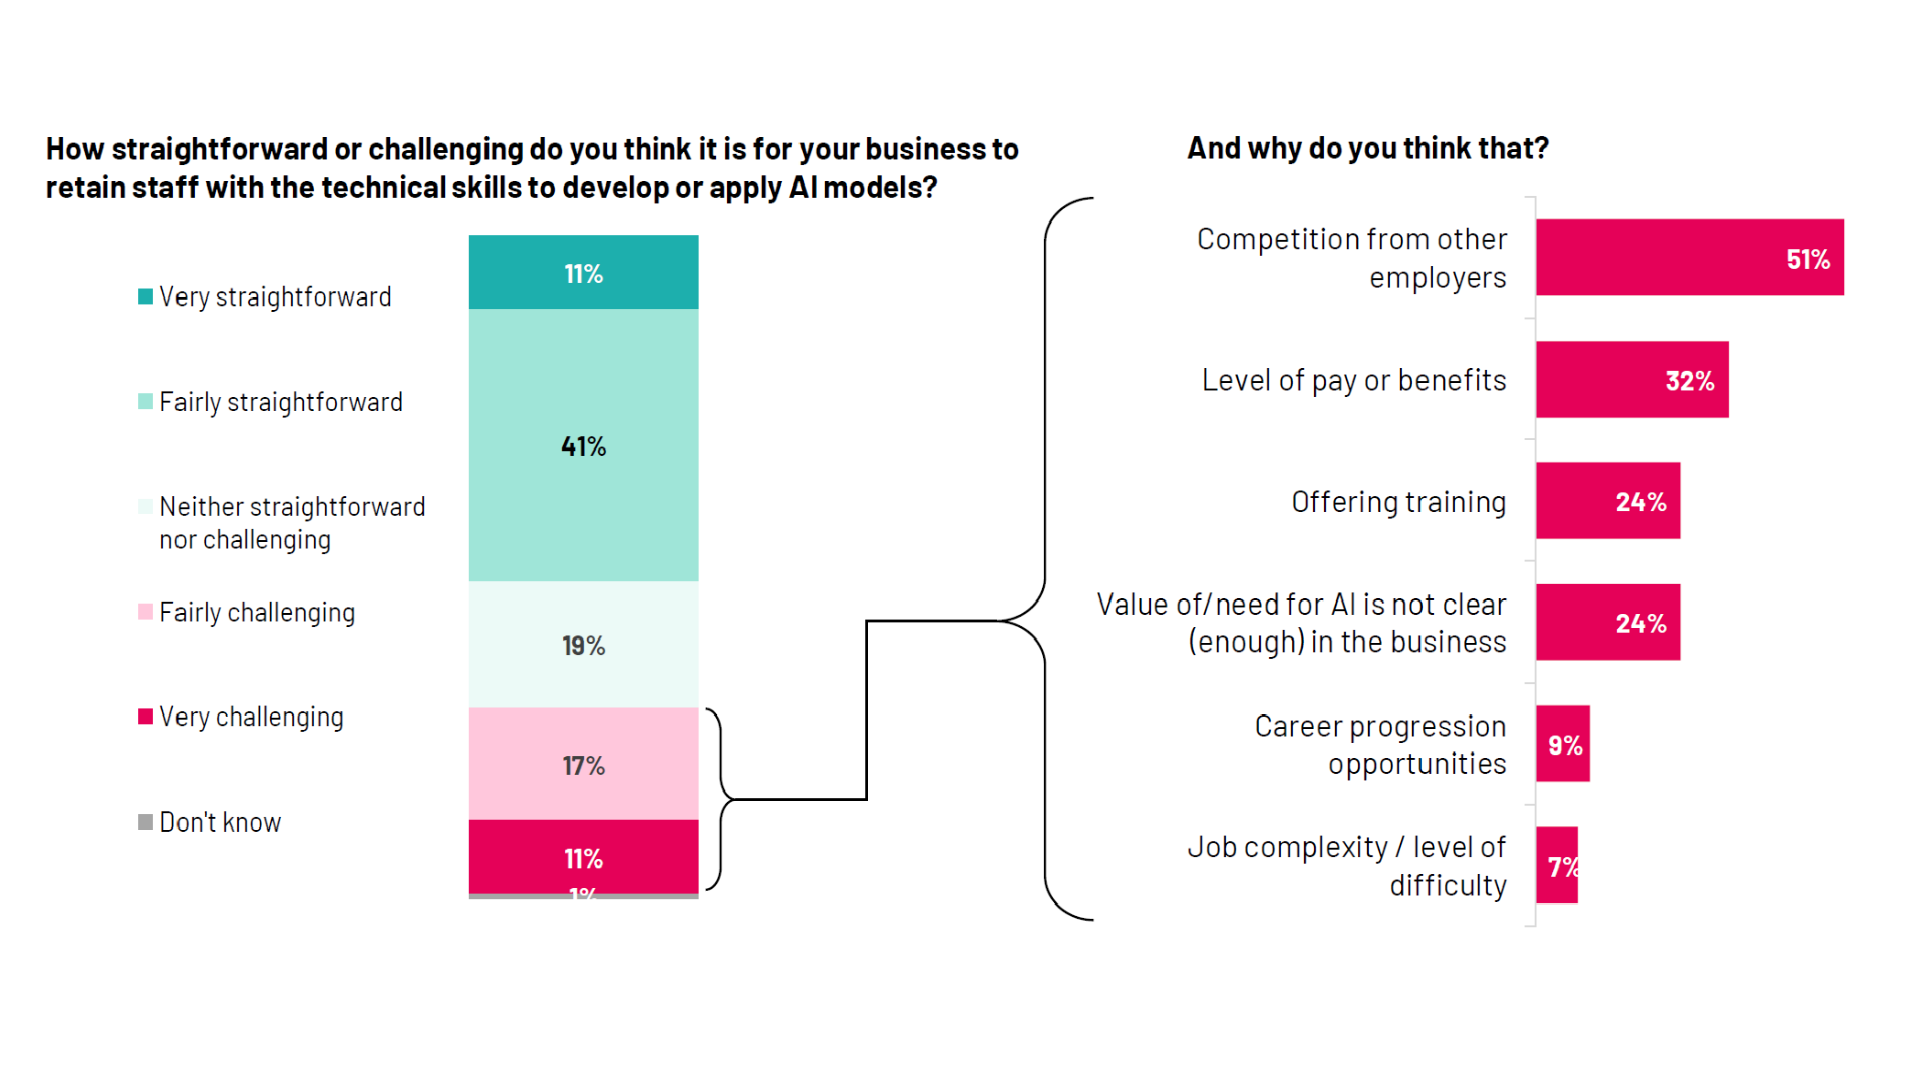
Around 3 in 10 find retention of technically skilledĀ AIĀ staff challenging, primarily due to competition from other employers. Figure 5.5 shows that 28% of employers find retaining technically skilledĀ AIĀ staff challenging and that the primary reason for this challenge is competition from other employers, cited by 51%.
Figure 5.5: ā€œHow straightforward or challenging do you think it is for your business to retain staff with the technical skills to develop or applyĀ AIĀ models?ā€ mapped to ā€œAnd why do you think that?ā€
Base: All UK employers who have tried to recruit in last 3 years or have technical staff working withĀ AIĢż(n=118) for Part 1. Base: All UK employers who had retention challenges (n=40*) for Part 2. * small base
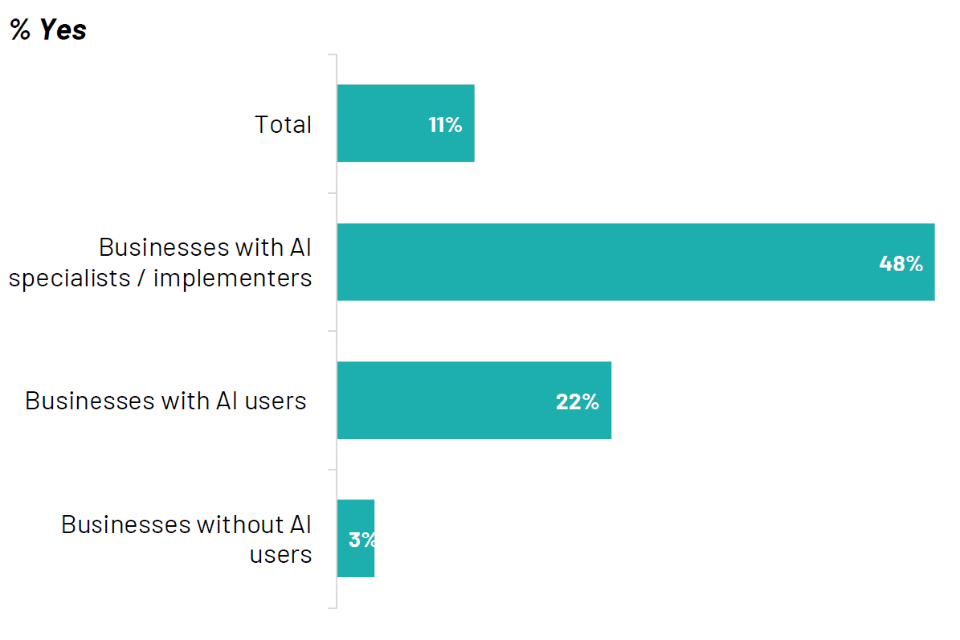
11% of employers have undertaken some form ofĀ AIĀ training in the last 12 months, but this is much higher among employers withĀ AIĀ specialist staff. Figure 5.6 shows that 11% of all employers have undertakenĀ AIĀ training in the last 12 months. This figure rises to 48% for businesses that haveĀ AIĀ specialists or implementers.
Figure 5.6: ā€œIn the last 12 months, have you or your employees undertaken any training to improveĀ AIĀ knowledge or skills?ā€ Percentage that answered ā€œyesā€
Base: All UK employers (n=801); All UK employers with staff with technicalĀ AIĀ skills (n=113); All UK employers with staff with skills to work with or useĀ AIĢż(n=334); All UK employers with no current staff working withĀ AIĢż(n=428)
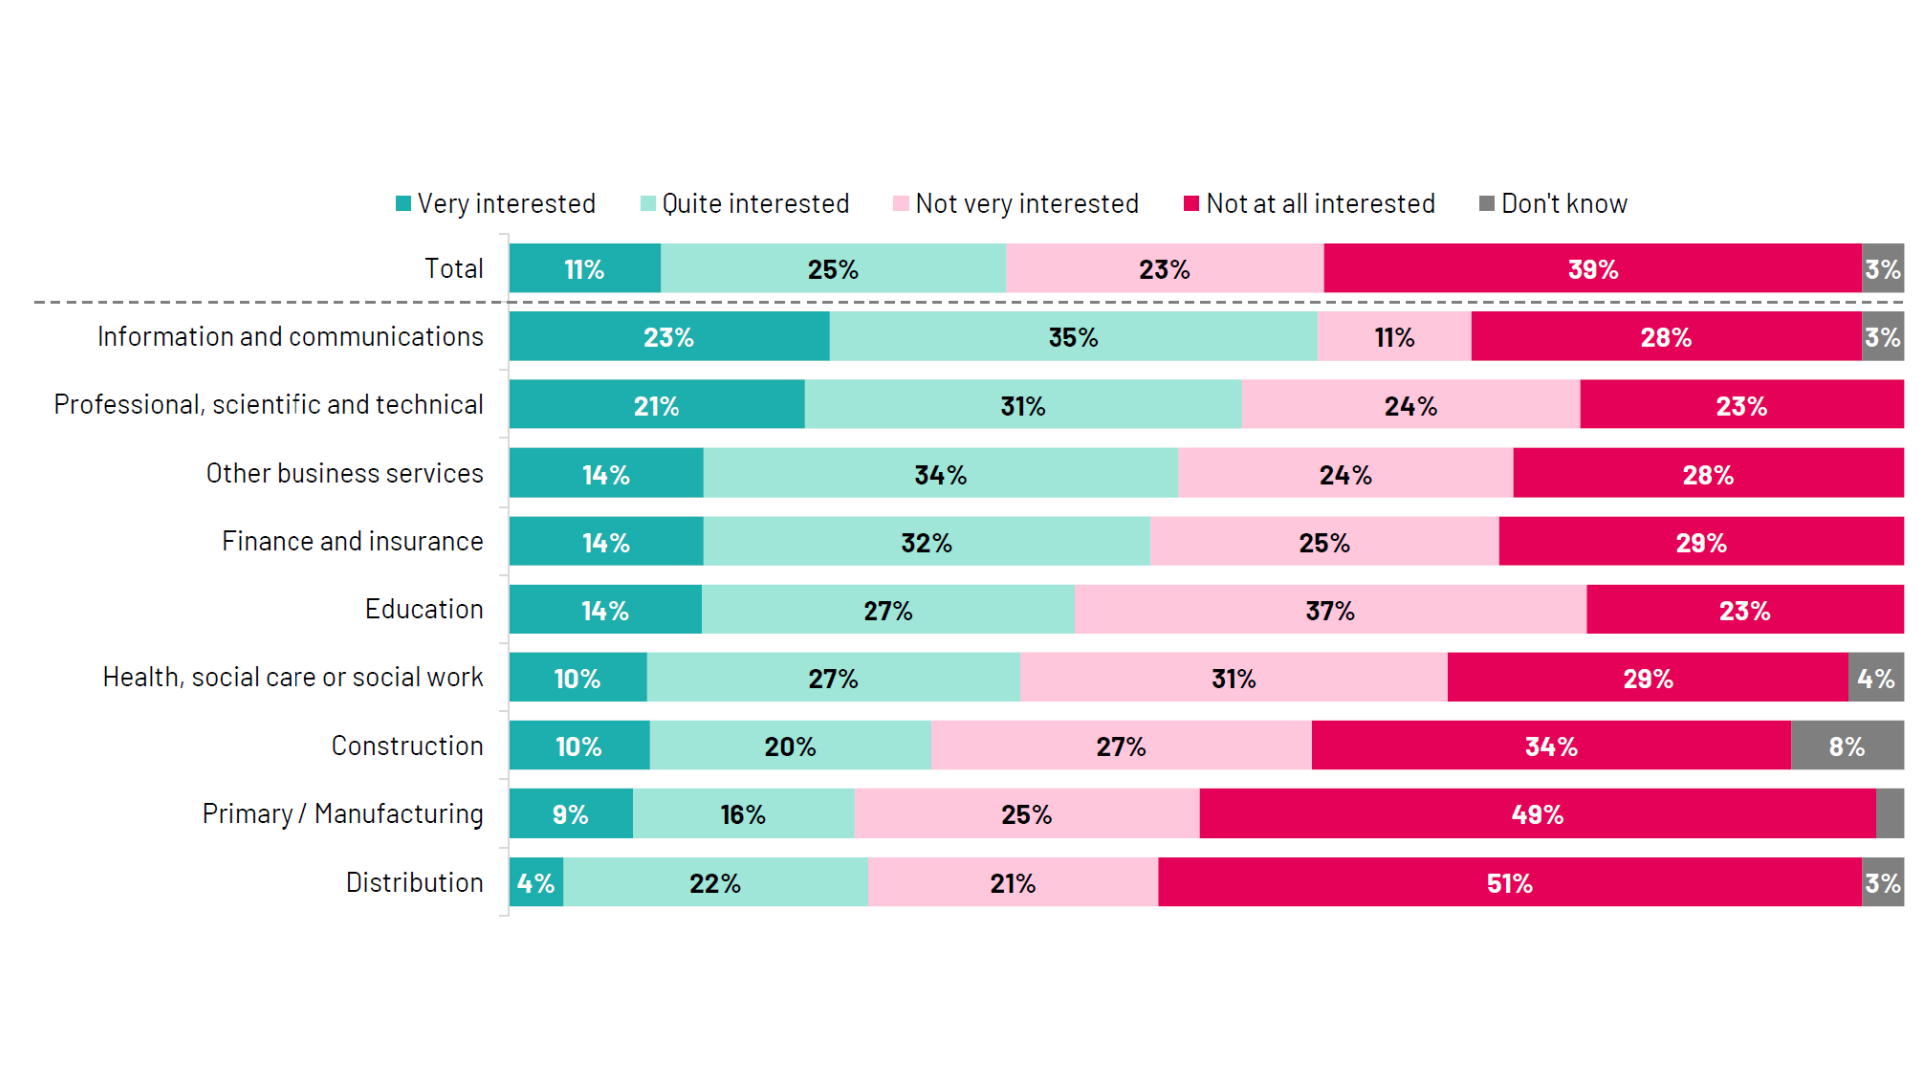
36% are interested in undertakingĀ AIĀ training in the future. Interest inĀ AIĀ training in the future is mixed, but highest in IT and professional, scientific and technical sectors. Figure 5.7 shows interest in futureĀ AIĀ training by sector. Interest is highest in ā€˜Information and communicationsā€™, where 58% are very or quite interested. Interest is lowest in ā€˜Distributionā€™, where only 26% are very or quite interested.
Figure 5.7: ā€œHow interested, if at all, would your business be in undertaking training inĀ AIĀ in future?ā€ survey question responses
Base: All UK employers (n=801); Primary/Manufacturing (n=59); Construction (n=39); Distribution (n=109); Information and communications (n=103); Finance and Insurance (n=128); Professional, scientific and technical (n=92*); Other business services (n=47); Education (n=72); Health, social care or social work (n=125). * small base (sectors with base below 30 are not shown)
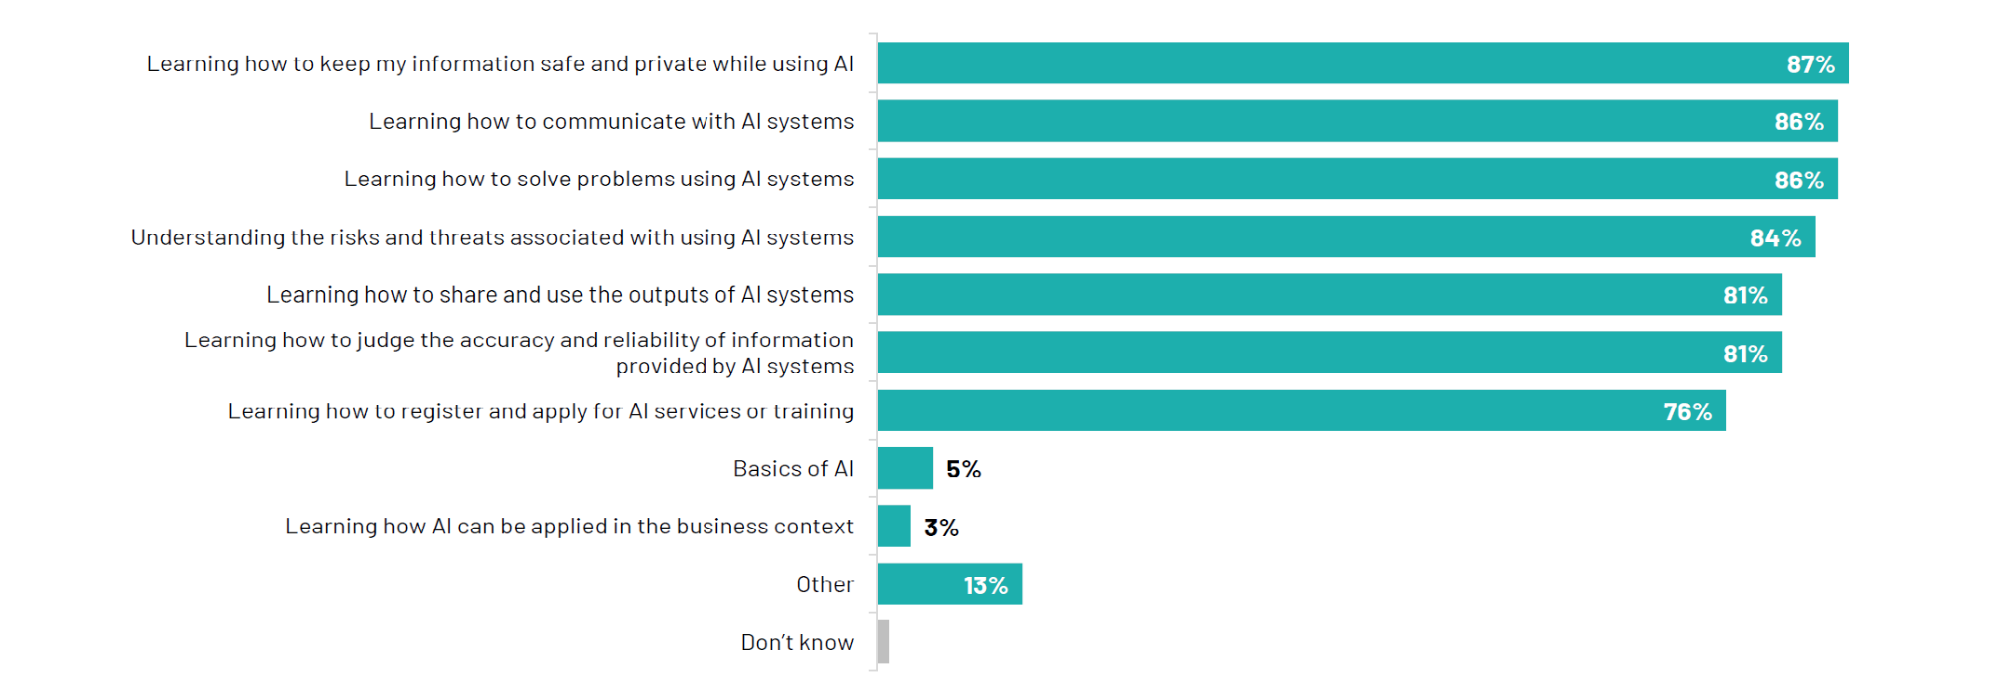
Interest is strong for most areas ofĀ AIĀ training, including understanding how to keep information safe and private while usingĀ AI. Figure 5.8 shows desiredĀ AIĀ training topics. 87% of interested employers want training on keeping information safe and private. 86% want training on communicating withĀ AIĢż²õ²ā²õ³Ł±š³¾²õ and solving problems withĀ AI.
Figure 5.8: ā€œWhat would your business like this training to consist ofā€¦?ā€ survey question responses
Base: All UK employers who are interested in undertakingĀ AIĀ training in future (n=344)
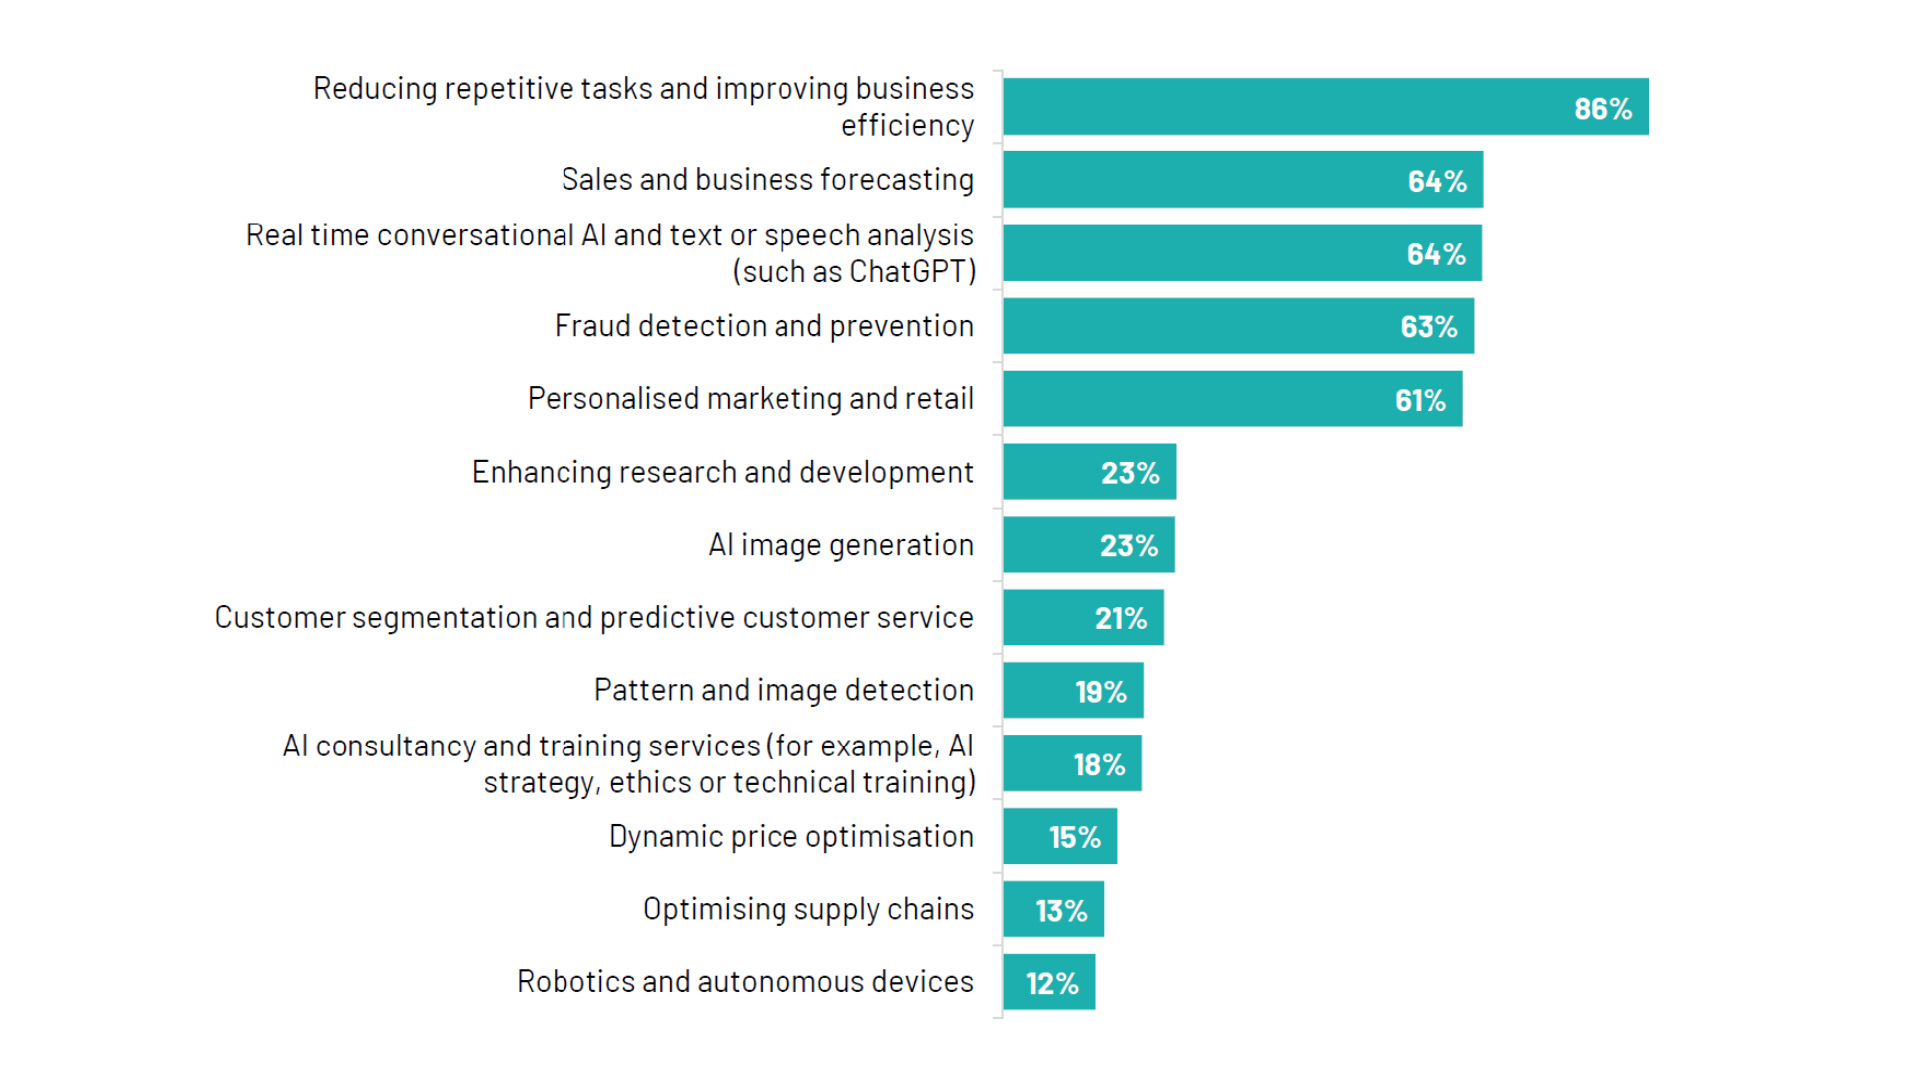
±«²õ¾±²Ō²µĢżAIĀ to reduce repetitive tasks is the most popular area that employers want their business to be trained in. Figure 5.9 shows that, amongst employers interested in training, 86% want training on usingĀ AIĀ to reduce repetitive tasks and improve efficiency. Training on sales forecasting and conversationalĀ AIĀ are both desired by 64%.
Figure 5.9: ā€œWhich particularĀ AI-driven products or services, if any, would your business wantĀ AIĀ training in?ā€ survey question responses from employers who are interested in undertakingĀ AIĀ training in the future
Base: All UK employers who are interested in undertakingĀ AIĀ training in future (n=344)
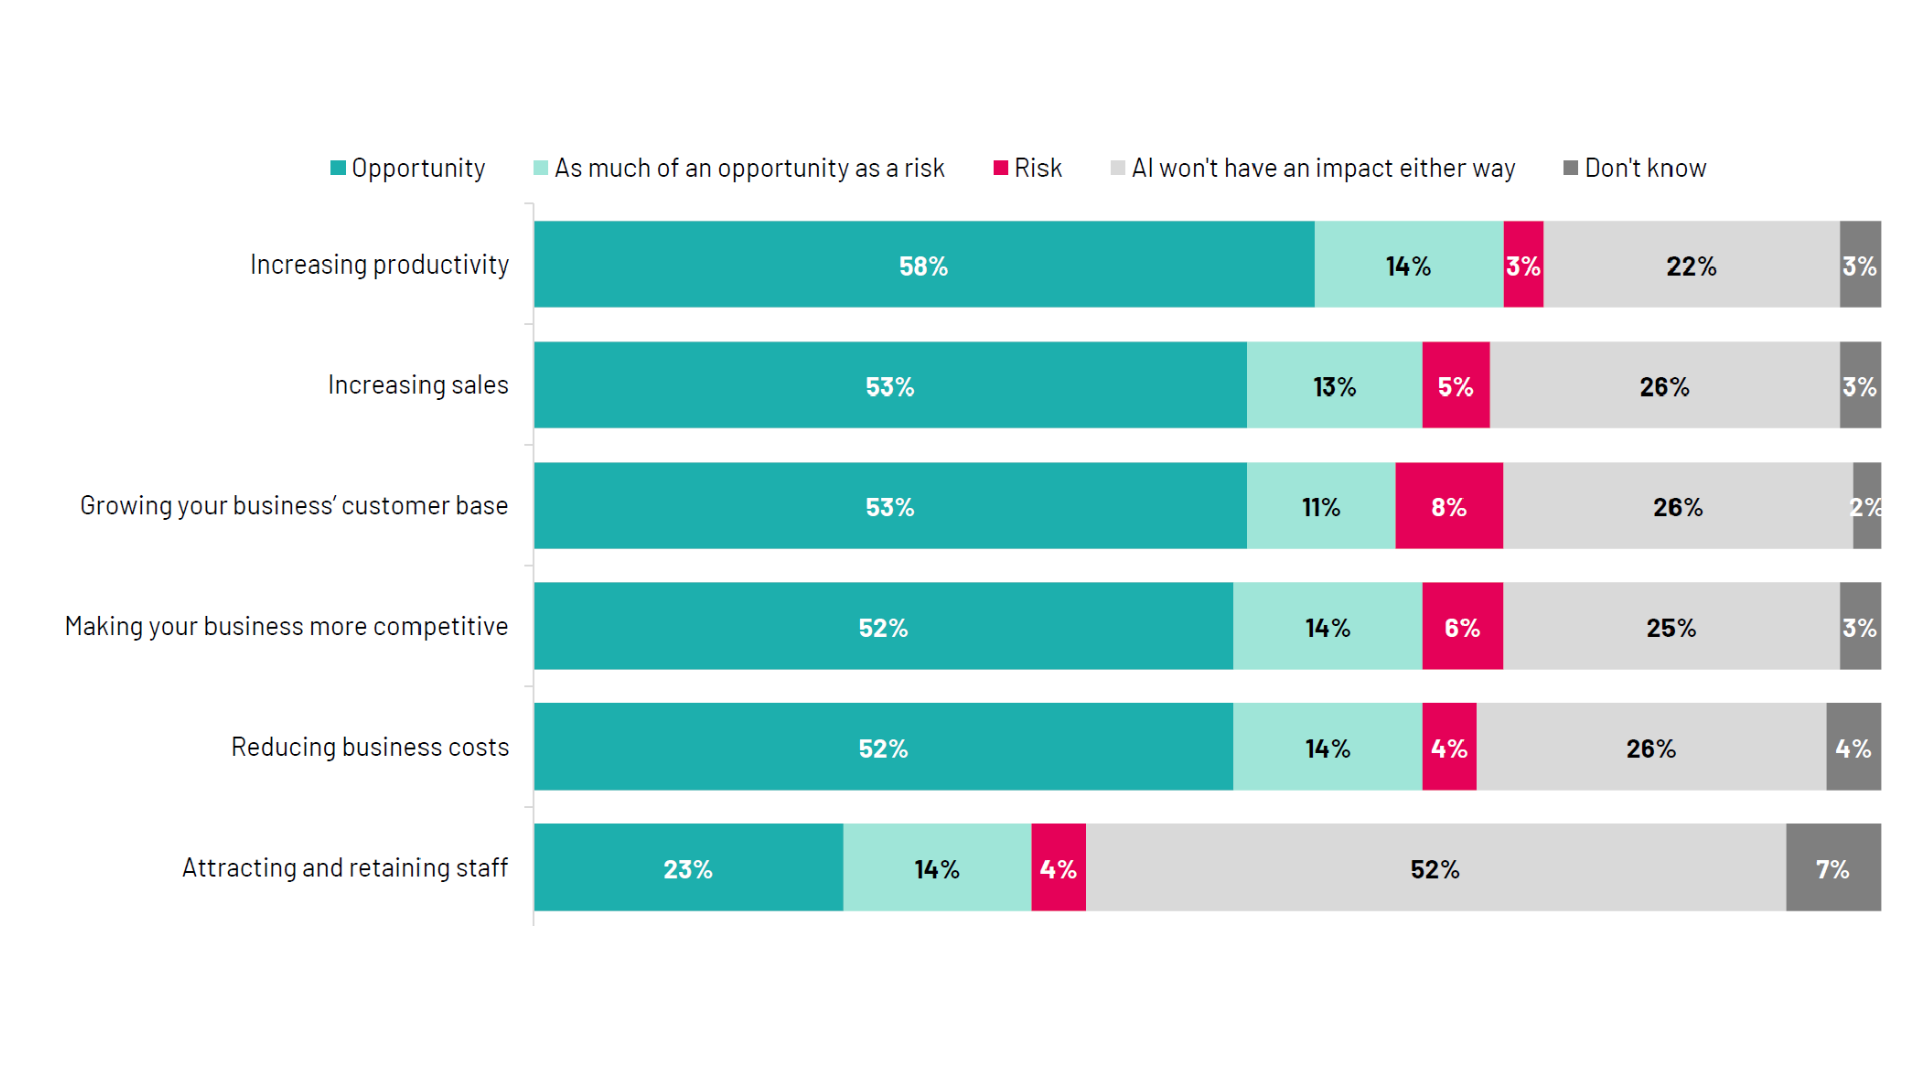
Productivity improvements are seen as the biggest opportunity for further integration ofĀ AIĀ into business plans, followed by increased sales. Figure 5.10 shows that senior leadership viewsĀ AIĀ as an opportunity. 58% see it as an opportunity for increasing productivity, and 53% see it as an opportunity for increasing sales and growing their customer base.
Figure 5.10: ā€œOn balance, does the senior leadership of your business considerĀ AIĀ as more of an opportunity or a risk to your business with respect to ā€¦?ā€ survey question responses
Base: All UK employers whose business model 3 to 5 years from now will rely on or useĀ AIĢż(n=428)
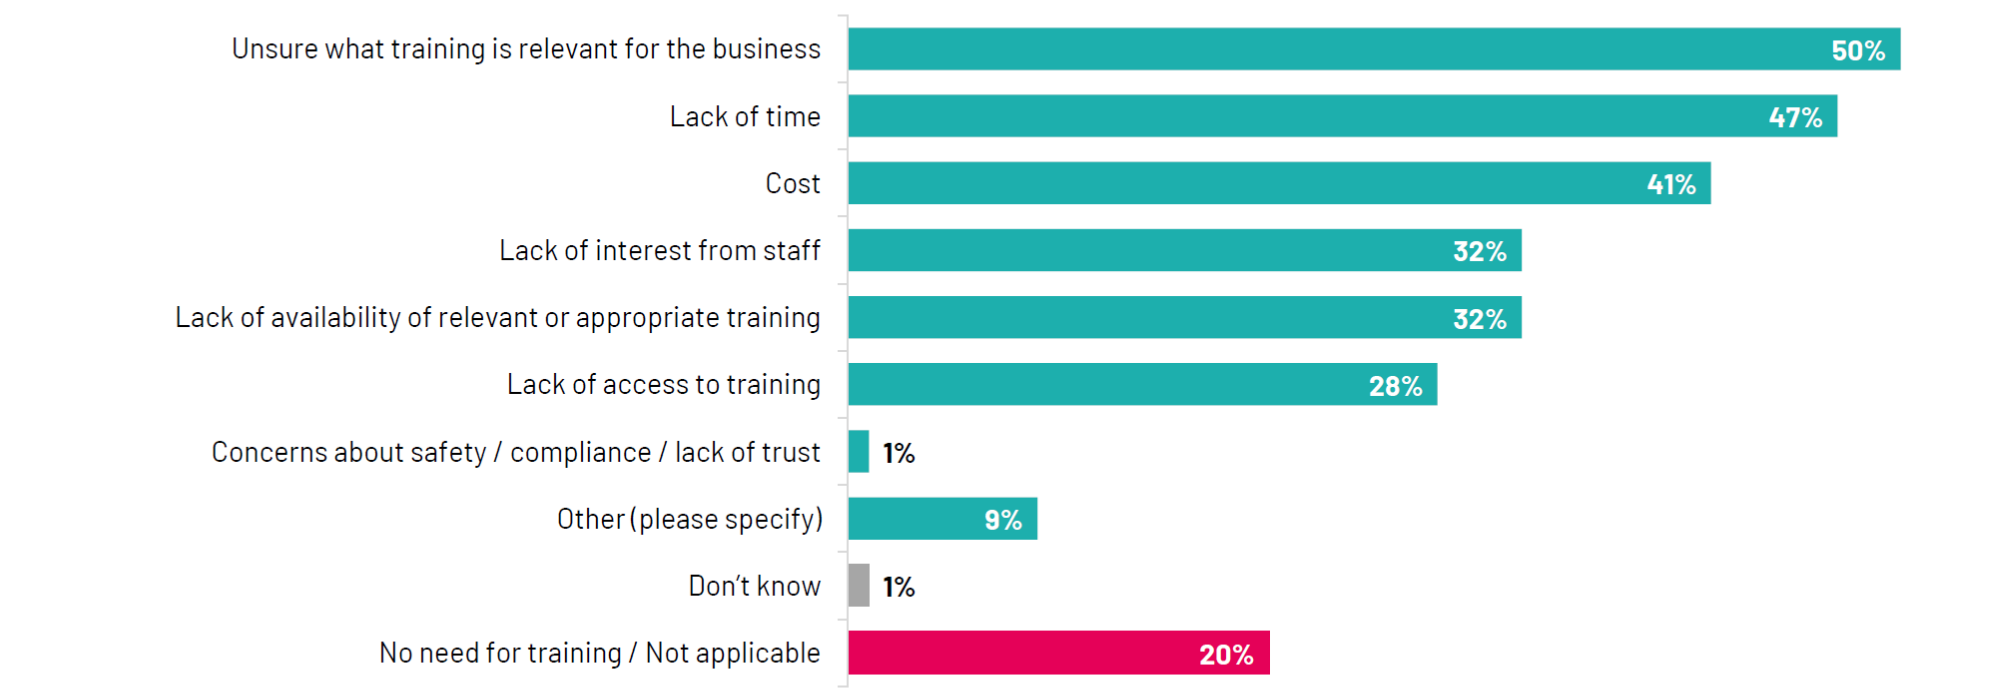
Uncertainty around what training is relevant for the business and lack of time are employersā€™ main barriers to engaging withĀ AIĀ upskilling. Figure 5.11 shows barriers toĀ AIĀ upskilling. The main barrier is being unsure what training is relevant for the business, cited by 50% of employers. Lack of time is the second-biggest barrier at 47%, followed by cost at 41%.
Figure 5.11: ā€œWhat barriers does your business face, if any, to engaging with training or upskilling related toĀ AI?ā€ survey question responses
Base: All UK employers (n=801)
6. Summary
6.1 Conclusions
The employer survey highlighted that only 1 in 3 of UK employers say they currently useĀ AIĢż(as of June 2024). Furthermore, this usage is predominantly focused among specialist businesses in, for example, the IT sector. The majority (6 in 10) of UK employers do not useĀ AIĀ and do not have any plans to incorporate it.
These issues withĀ AIĀ adoption appear to stem from the top of the businesses as only 34% of employers say that their senior leadership team can identify new opportunities to useĀ AIĀ in the business.Ā AIĀ usage is seen as a ā€˜nice-to-haveā€™. Among those who use it, 94% say they use but do not rely on the technology. In addition, only 1 in 10 UK employers have undertaken anyĀ AIĀ training and only 4% of UK employers have actively tried to recruit someone withĀ AIĀ skills in the last 3 years.
Skill levels overall are also quite low. 56% of employers whose businesses are currently using or planning to useĀ AIĀ rate the level of knowledge in their business overall as ā€˜beginnerā€™ or ā€˜noviceā€™, and 61% of all employers have no staff currently working withĀ AI.
Nevertheless, the impact of generativeĀ AIĀ is clear to see. 39% of UK employers usingĀ AIĀ say that real-time conversationalĀ AIĀ is currently being used in their business. There is also recognition thatĀ AIĀ may represent an opportunity to increase productivity.
1 in 3 UK employers would be interested in undertakingĀ AI-related training in their business in future. It is clear that more needs to be done to educate workers at all levels of a business on how to useĀ AIĀ if a majority of UK employers are to take this technology up.
6.2 There is potential for tailoring skills policy to different types of employers
AIĀ Specialists and ImplementersĀ There is less of a need to upskill technicalĀ AIĀ businesses as they are already at the forefront of the innovation and therefore know how to keep up with developments. The problem for this type of business with be labour shortages for further recruitment ofĀ AIĀ skilled workers (rather than any particular requirement to upskill their current workforce).
AIĀ UsersĀ 1 in 3 businesses areĀ AIĀ users, but only 1 in 10 businesses have accessed training and the vast majority (94%) say thatĀ AIĀ is a nice to have rather than something they rely on. So further training for this business type may be required. Results suggest that any training that highlight howĀ AIĀ will improve productivity and reduce time taken on repetitive tasks could be most useful.
AIĀ Non-UsersĀ 6 in 10 UK businesses do not have any staff that useĀ AIĀ and do not plan to use the technology in the next five years either. Efforts could focus on the senior leadership team at these businesses as they will be able to adjust business plans to make fundamental changes, but currently two in three businesses say the leadership team do not understand the opportunities forĀ AIĀ within their sector. Being typically C-suite, they will findĀ AIĀ use cases that increase sales and attract new customers as the most compelling and are not particularly interested in how the technology works.
7. Appendix
Table 7.1: Business profile ā€“ sector
| Sector | Target | Achieved | % (out of 100%) | Weighted* % |
|---|---|---|---|---|
| ABCDE Primary / manufacturing | 56 | 59 | 7% | 10% |
| F Construction | 43 | 39 | 5% | 14% |
| GHI Distribution | 129 | 109 | 14% | 31% |
| J Information and Communications | 100 | 103 | 33% | 5% |
| K Finance and Insurance | 130 | 128 | 16% | 2% |
| M Professional, scientific and technical | 86 | 92 | 11% | 13% |
| LN Other business services | 55 | 47 | 6% | 2% |
| P Education | 60 | 72 | 9% | 4% |
| Q Health, social care or social work | 118 | 125 | 16% | 7% |
| RS Other services | 23 | 27 | 4% | 23% |
| Total | 800 | 801 | 100% | 100% |
Table 7.2: Business profile ā€“ size
| Size band | Target | Achieved | % (out of 100%) | Weighted* % |
|---|---|---|---|---|
| Micro (1-9) | 380 | 418 | 52% | 64% |
| Small (10-49) | 150 | 196 | 24% | 32% |
| Medium (50-249) | 150 | 140 | 17% | 2% |
| Large (250+) | 120 | 41 | 5% | 1% |
*Based on the October 2023 business population estimates. Note that some participants did not give size of business
Table 7.3: Business profile ā€“ region
| Region | Target | Achieved | % (out of 100%) | Weighted* % |
|---|---|---|---|---|
| East | 50 | 52 | 6% | 6% |
| East Midlands | 70 | 77 | 10% | 13% |
| London | 125 | 104 | 13% | 15% |
| North East | 21 | 20 | 2% | 3% |
| North West | 72 | 69 | 9% | 10% |
| South East (excl. London) | 104 | 114 | 12% | 18% |
| South West | 64 | 70 | 9% | 9% |
| West Midlands | 60 | 54 | 7% | 5% |
| Yorkshire and Humberside | 60 | 52 | 6% | 7% |
| Scotland | 60 | 66 | 8% | 7% |
| Wales | 60 | 61 | 8% | 4% |
| Northern Ireland | 60 | 62 | 8% | 3% |
| Total | 800 | 801 | 100% | 100% |
*Based on the October 2023 business population estimates