Bulletin: BDUK Delivery Performance, annual: April 2025 to March 2026
Published 11 June 2026

© Crown copyright 2026
This publication is licensed under the terms of the Open Government Licence v3.0 except where otherwise stated. To view this licence, visit or write to the Information Policy Team, The National Archives, Kew, London TW9 4DU, or email: psi@nationalarchives.gov.uk.
Where we have identified any third party copyright information you will need to obtain permission from the copyright holders concerned.
This publication is available at /government/statistics/bduk-delivery-performance-annual-april-2025-to-march-2026/bulletin-bduk-delivery-performance-annual-april-2025-to-march-2026
1. About this releaseÌý
This annualÌýofficialÌýstatistics report presents how many premises in the United Kingdom have received a gigabit-capable broadband connectionÌýas a result ofÌýBuilding Digital UK (BDUK)Ìýsubsidy. The figures cover premises that received gigabit-capable coverage throughÌýBDUKÌýsubsidy between 1 April 2025 and 31 March 2026.ÌýÌýThis publication includes updates to previously reported delivery figures.ÌýÌý
2. Headline findingsÌý
We estimate that BDUK interventions delivered gigabit-capable broadband coverage to 192,570ÌýpremisesÌýin 2025/26, an increase of 42,280Ìý(28%) premises compared with the previousÌýfinancial year.Ìý
Since the launch of BDUK gigabit programmes, an estimated cumulative total of 1,418,410 premisesÌýhaveÌýreceived gigabit-capable coverage through BDUK subsidy.Ìý
Delivery in 2025/26 was primarily driven by Gigabit Infrastructure Subsidy (GIS) contracts, which accounted forÌý72%Ìý(139,490 premises) of all premises delivered. Voucher schemes contributedÌý16% (30,530 premises), while Superfast and Hubs interventions accounted for the remaining 12% (22,550 premises).ÌýThe figures reported for GIS do not include deliveryÌýfor contracts in which BDUK is not the leading authority.ÌýÌý
Delivery continued to be concentrated in rural areas, which represented 90% (173,190Ìýpremises) of all premises delivered during the year.Ìý
Most premises delivered were residential properties.ÌýIn 2025/26,Ìý90% (173,270Ìýpremises) were classified as residential ²¹²Ô»åÌý9% (17,790Ìýpremises) as commercial.Ìý
England accounted forÌýapproximately three quarters ofÌýthe delivery (75%, 145,110Ìýpremises), followed by Scotland (16%, 30,530Ìýpremises), Wales (8%, 15,430 premises), ²¹²Ô»åÌýNorthern Irel²¹²Ô»åÌý(1%, 1,470Ìýpremises).Ìý
3. OverviewÌý
This bulletin presents annual official statistics on the delivery performance of BDUK (Building Digital UK) for theÌýfinancial yearÌý2025/26.ÌýIt includes breakdowns by:Ìý
-
Time period (years and quarters)Ìý
-
³Ò±ð´Ç²µ°ù²¹±è³ó¾±±ð²õÌý
-
Urban/rural classificationÌýÌý
-
Commercial/residential classificationÌý
-
Whether the premises are in the Ofcom premises baseÌý
-
Broadband speed classificationÌýÌý
-
Intervention typeÌýÌý
4. Overall delivery trendsÌý
The cumulative number of premises delivered by BDUK since theÌýinceptionÌýof gigabit programmesÌýinÌý2012,Ìýreached 1,418,410 by the end of March 2026.Ìý
BDUK delivered gigabit-capable coverage toÌý192,570Ìýpremises between 1 April 2025Ìýand 31 March 2026,Ìý42,280Ìý(28%)Ìýmore than in the previousÌýfinancial year.Ìý
Figure 1Ìýshows that,Ìýwhile delivery throughÌýVoucher, Hubs, ²¹²Ô»åÌýSuperfast interventions decreased compared with 2024/25, this wasÌýmore thanÌýoffsetÌýby increased delivery through Gigabit Infrastructure Subsidy contracts. This reflects the continued transition from legacyÌýinterventionsÌýtowards Gigabit delivery programmes.Ìý
Figure 1:Ìý Premises passed by BDUK intervention, UK, 2021/22 to 2025/26
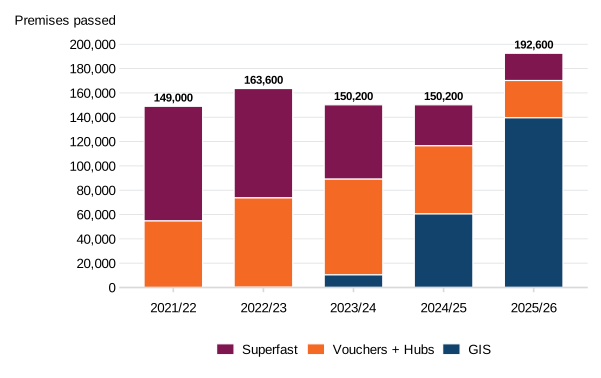
GIS contracts became the largest contributor to annual delivery growth in 2024/25, accounting for an increasing share of total deliveryÌýin 2025/26. In contrast, delivery throughÌýVouchers,ÌýHubs, ²¹²Ô»åÌýSuperfastÌýcontinued to decline as these programmes approach their final stages.Ìý
5. GeographicÌýdistribution of deliveryÌý
Delivery across the UK reflects differing levels of maturity in delivery programmes, with countries atÌýdifferent stages.ÌýIn particular,ÌýtheÌýfigures reported for GISÌýdo not include delivery for contracts in ²¹²Ô»åÌý forÌýwhich BDUK is not the leading authority.Ìý
5.1 By countryÌý
Of theÌý192,570Ìýpremises deliveredÌýin 2025/26:Ìý
-
75% (145,110Ìýpremises) were delivered in Engl²¹²Ô»åÌýÌý
-
16% (30,530 premises) in Scotl²¹²Ô»åÌýÌý
-
8% (15,430 premises) in WalesÌýÌý
-
1% (1,470 premises) in Northern Irel²¹²Ô»åÌý
FigureÌý2:Ìý Premises passed by country, UK, 2021/22 to 2025/26
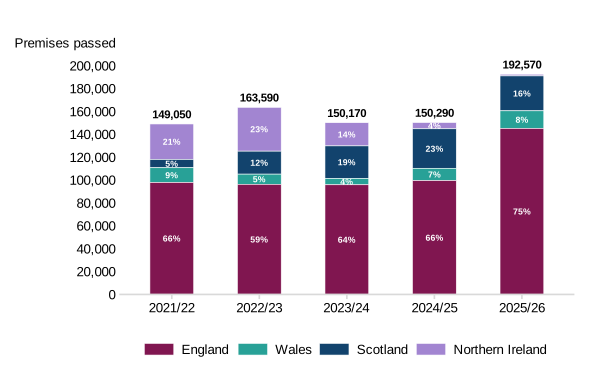
FigureÌý2Ìýshows the distribution of premises passed by country over time. England accounted forÌýapproximatelyÌýtwo thirdsÌýofÌýthe delivery inÌýpreviousÌýyears, with its share increasing to 75% in 2025/26.ÌýÌýThis corresponds to around 145,100 premises delivered in the latest year, reflecting a continued concentration of delivery in England, particularly in large rural contract areas. Delivery is primarily driven by Gigabit Infrastructure Subsidy (GIS) contracts, which have scaled up in recent years.Ìý
ÌýScotland’s share of delivery increased steadily between 2021/22 and 2024/25, reaching around 23%,ÌýbeforeÌýdecreasingÌýto 16% in 2025/26. Despite this decrease,ÌýScotland continues to account for a substantial proportion of annual delivery relative to its size.ÌýThis corresponds to around 30,500 premises delivered in 2025/26, with annual delivery in Scotl²¹²Ô»åÌýremainingÌýbroadly stable at around 30,000 premises per year over the past three years. Delivery is now primarily driven by Scottish GIS contracts, alongside remaining activity from legacy Superfast contracts.Ìý
Wales accounted for aÌýrelatively stableÌýshare of delivery over time, increasing slightly to 8% in 2025/26 following lower contributions in earlier years.ÌýÌýThis equates to around 15,400 premises delivered in 2025/26, with annual deliveryÌýremainingÌýmodest compared to England and Scotland,ÌýbutÌýabove averageÌýrelativeÌýto its size. Delivery in Wales isÌýlargely drivenÌýby ongoing GIS contracts, as earlier Superfast and voucherÌýinterventionsÌýcontinue to wind down.ÌýÌý
Northern Ireland’s shareÌýdecreasedÌýmarkedly over the period, from over 20% in 2021/22 toÌýapproximatelyÌý1% in 2025/26.ÌýHowever, due to the significant share of delivery in earlier yearsÌý²¹²Ô»åÌýthe completion of key contracts in recent years, overall gigabit coverage in Northern Irel²¹²Ô»åÌýisÌýmaterially higher thanÌýthe UK averageÌý– according to the latestÌý,Ìý95%Ìýof Northern Ireland premises have access to gigabit-capable broadband, compared to 88% across the UK. Therefore,Ìýa lowerÌýshareÌýof delivery in Northern Irel²¹²Ô»åÌýis notÌýunexpected.ÌýÌýÌýÌý
Overall, the increase in delivery in 2025/26 was driven primarily by growth in England, where delivery increased from aroundÌý99,510 premisesÌýin 2024/25 to 145,100 in 2025/26. Delivery in Wales also increased, from 10,790Ìýto 15,430 premises. In contrast, delivery in Scotland decreased slightly compared with the previous year (from 34,730 to 30,530 premises), while Northern Ireland saw a more pronounced decline (from 5,460 to 1,470Ìýpremises).Ìý
5.2 By regionÌý
Within England, theÌýSouth WestÌýrecorded the highest level of deliveryÌýin 2025/26, with 27,630Ìýpremises delivered. This was followed byÌýYorkshireÌýand the HumberÌý(27,090Ìýpremises) ²¹²Ô»åÌýtheÌýNorth WestÌý(25,100Ìýpremises).Ìý
FigureÌý3. Delivery by region, England, 2021/22 to 2025/26
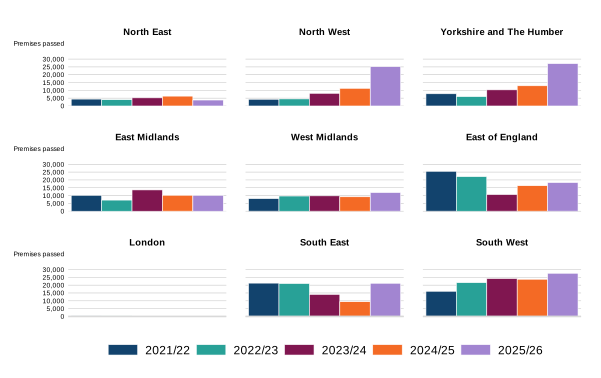
Higher levels of delivery continued to beÌýobservedÌýinÌýpredominantly ruralÌýregions where commercial rollout is moreÌýchallenging,Ìýand subsidy interventions are more likely to beÌýrequired. Several regions recorded stronger delivery during the second half of 2025/26ÌýasÌýadditionalÌýGigabit contract areas became operational.ÌýÌý
5.3 ByÌýlocalÌýauthorityÌýdistrictÌýÌý
The local authority districts with the highest levels of deliveryÌýin 2025/26 wereÌýconcentrated in a small number of large ²¹²Ô»åÌýpredominantly ruralÌýareas. Cumberland recorded the highest delivery (9,540 premises), followed by North Yorkshire (9,170), Westmorland and Furness (8,560), and East Riding of Yorkshire (7,420).ÌýÌý
Table 1 shows that the top 10 local authority districts are dominated by areas in northern England and Scotland, including Highland (6,760) and large rural authorities in theÌýsouthwestÌýsuch as Cornwall (6,220), Wiltshire (5,830), and Dorset (4,220).Ìý
TableÌý1. Top 10 local authority districts by premises delivered, UK, 2025/26
| Local Authority District | Premises Passed |
|---|---|
| Cumberland | 9,540 |
| North Yorkshire | 9,170 |
| Westmorland and Furness | 8,560 |
| East Riding of Yorkshire | 7,420 |
| Highland | 6,760 |
| Cornwall | 6,220 |
| Wiltshire | 5,830 |
| Dorset | 4,220 |
| East Lindsey | 4,090 |
| West Suffolk | 3,940 |
These patternsÌýindicateÌýthat the highest levels of delivery are concentrated in rural areas, where subsidy is targeted towards harder-to-reach premises and where wider commercial deployment is less likely. Delivery in these areas is typically associated with large Gigabit Infrastructure Subsidy (GIS) contract areas, which cover extensive geographic regions with lower population density.Ìý
5.4 ByÌýrural/urbanÌýclassificationÌýÌý
In 2025/26Ìý173,190Ìýpremises (90%) delivered by BDUK were in rural areas. This reflects the continued focus of subsidy on harder-to-reach locations where commercial deployment is lessÌýviable. Urban areas accountedÌý9% of delivery, with the remaining records classified as Unknown dueÌýto lack ofÌýappropriate matching.Ìý
FigureÌý4. Delivery by grouped rural and urban classification, UK, 2021/22 to 2025/26
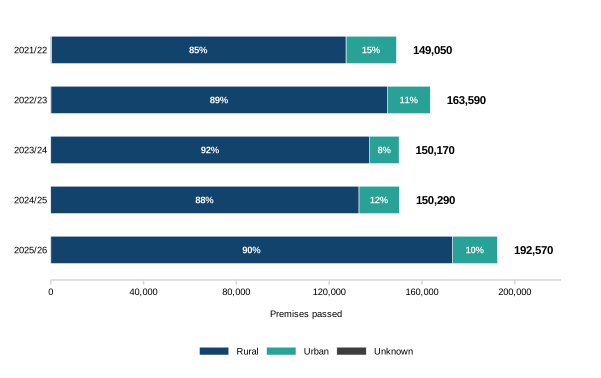
FigureÌý4Ìýshows the distribution of premises passed by rural and urban classification over time. Delivery has been consistently concentrated in rural areas, which accounted for between 85% and 92% of total delivery across the period.Ìý
The increase in total delivery in 2025/26 was therefore driven primarily by rural areas, with urban deliveryÌýremainingÌýa small ²¹²Ô»åÌýrelatively stableÌýproportion of the total.ÌýThis distribution remained broadly consistent across all the quarters ofÌýthe year.ÌýÌý
6. ByÌýpremisesÌýcharacteristicsÌý
6.1 ByÌýpremisesÌýtypeÌý
Most premises deliveredÌýin 2025/26 wereÌýresidential properties. Residential premises accounted forÌý90%Ìý(173,270Ìýpremises) of annual delivery.ÌýÌý
Figure 5. Delivery by premises type, UK, 2021/22 to 2025/26
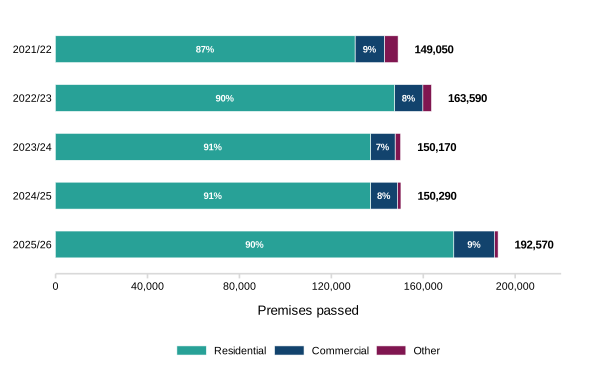
Figure 5 highlights that residential premises continued to account for most subsidised delivery. The composition of delivery by premises type remained stable over time, with residential premises consistently accounting for the large majority of BDUK delivery. This distribution remained broadly consistent across all quarters of 2025/26.Ìý
6.2 By Superfast availability (>30 Mbit/s)ÌýÌý
An estimatedÌý43,880ÌýpremisesÌý(23%) deliveredÌýin 2025/26Ìýdid not previously have access to superfast broadband speeds of at least 30 Mbit/s.Ìý
Figure 6. Delivery by availability of superfast broadband, UK, 2021/22 to 2025/26
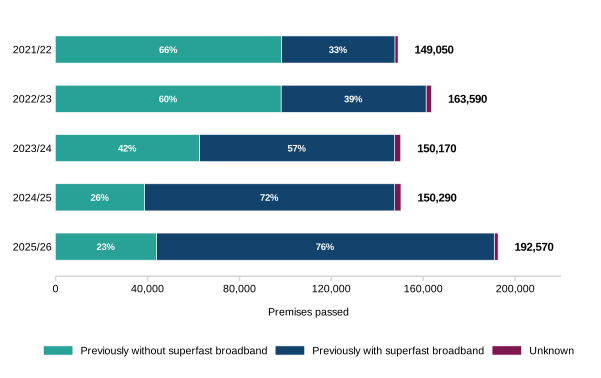
Figure 6 shows how the composition of delivery by broadband availability has changed over time. In earlier years, most delivery was to premises without superfast broadband. However, this proportion has declined rapidly over time as overall levels of superfast coverage have increased across the country. This reflects both the expansion of superfast availability in the UK and changes in the focus of BDUK interventions.ÌýÌý
While the Superfast programme was primarily targeted at premises without access to superfast broadband, more recent contracts (i.e. GIS, Vouchers,ÌýHubs) support delivery to both premises without superfast coverage and those already able to access superfast services. As a result, a decreasing proportion of delivery has been directed towards premises without superfast broadband.ÌýÌý
In 2025/26, the proportion of delivery to premises without superfast coverage remained broadly stable across quarters. More broadly, as gigabit delivery has expanded, an increasing share of delivery has supported upgrades to higher-capacity broadband infrastructure rather than first-time access to superfast speeds.Ìý
7. Overall quarterly delivery trendsÌý
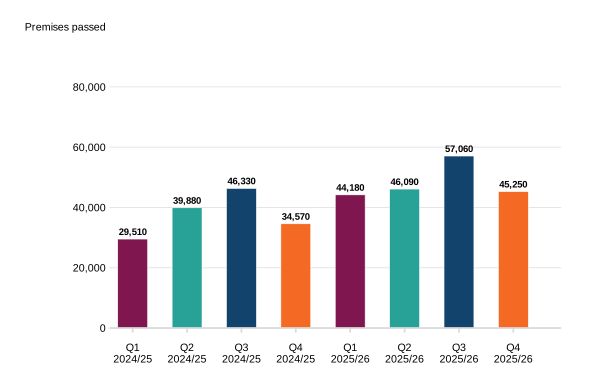
Quarterly delivery varied throughout 2024/25 and 2025/26, reflecting differences in contract mobilisation, supplier deployment schedules, and programme maturity across interventions and regions.Ìý
FigureÌý7aÌýshows delivery over the financial year.ÌýÌýDelivery increased in 2025/26 compared with 2024/25, driven primarily by the expansion of Gigabit Infrastructure Subsidy (GIS) contracts. However, quarterly delivery remained uneven across the year, with volumes rising from Q1 to Q3 before declining slightly in Q4, reflecting supplier delivery plans.Ìý
FigureÌý7a: premises passed to year end by quarters, UK, 2024/25 and 2025/26
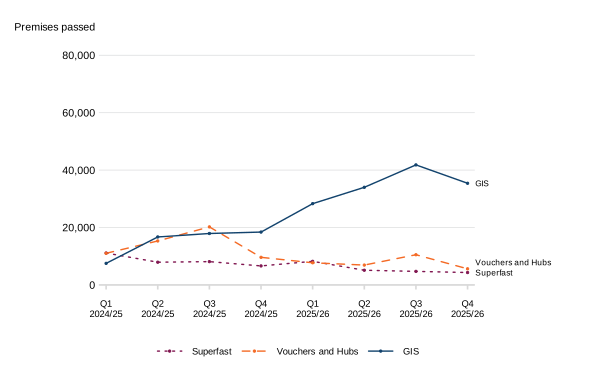
FigureÌý7b shows how these trends differ by intervention.ÌýGISÌýdelivery increasedÌýfor each quarter in 2024/25 and 2025/26 (except Q4 2025/26),ÌýasÌýadditionalÌýcontract areas becameÌýoperational,Ìýand delivery progressed on existing contracts. In contrast, delivery through Vouchers and Hubs peaked in Q3Ìý2024/25ÌýbeforeÌýbroadlyÌýdeclining inÌýlater quarters, while Superfast delivery followed a gradual downward trend throughout theÌýperiod.Ìý
FigureÌý7b:Ìý Quarterly delivery trends by BDUK intervention, UK, 2024/25 and 2025/26
8. Publication informationÌýÌý
8.1 Data sourcesÌý
We used the following data sources for thisÌýannualÌý2025/26Ìýperformance report:ÌýÌý
-
BDUK management information as ofÌý15ÌýMay 2026.ÌýÌý
-
Ìý
-
Ìý
-
Ìý
-
Ìý
-
Ìý
-
ÌýÌý
8.2 Revisions and changes fromÌýpreviousÌýreleasesÌý
This is BDUK’s annual official statistics release and builds on the figures previously published in the quarterly statistical series. In this release, the quarterly time series has been expanded to include quarterly delivery trends across 2024/25 and 2025/26.ÌýÌý
Historical figures are revised in each release to incorporate improved supplier reporting and updated delivery information. These revisions may alter:Ìý
-
delivery datesÌýÌý
-
intervention classificationÌýÌý
-
the number of premises deliveredÌý
Key revisionsÌýcompared to the previously published figures inÌýBDUK delivery performance, quarterly October to Dec 2025Ìýfor Q3 2025/26 (1 October 2025 to 31 December 2025):Ìý
-
Superfast:ÌýaÌýtotalÌýÌý730Ìýpremises passed has been added toÌýtheÌýfigures reportedÌýfor Q3 2025/26 (total reported in BDUK delivery performance, quarterly:ÌýOctoberÌý2025 toÌýDecÌý2025,Ìý4,010). This change is primarily attributableÌýtoÌýthe Scottish Government and North Devon (South West)Ìýcontracts, whichÌýare now approaching the final stages of delivery.ÌýAs part of suppliers’ data consolidation processes, historic figures have been reviewed and updated.ÌýÌý
-
GIS:Ìý30Ìýpremises haveÌýbeen removedÌýin the Gigabit Infrastructure Subsidy (GIS) delivery figures previously reportedÌýfor Q3 2025/26Ìý(41,830Ìýpremises passed)Ìýas a result ofÌýchanges across contractsÌý²¹²Ô»åÌýmethodologyÌýupdatesÌý
-
Vouchers:ÌýÌý310Ìýpremises have now been included in the Vouchers delivery figures previously reportedÌýfor Q3Ìý2025/26Ìý(10,150 premises passed),ÌýassociatedÌýtoÌýanÌýincreaseÌýin theÌýReady for ServiceÌý(RfS)Ìýreturns.ÌýÌý
8.3 Methodological improvementsÌýÌý
BDUK updates its historical time series with each release. This is because BDUK works closely with suppliers to improve the quality of their reporting; when improvements are made, we may receive revised information that alters the original delivery date of a premises or corrects the number of premises passed. This has resulted in changes to historical data, with movement between interventions and delivery periodsÌý
8.4 Known issuesÌýÌýÌý
BDUK is currently working onÌýa methodologyÌýto improve the identification of Unique Property Reference Numbers (UPRNs) for addresses which currently do not have an associated one; this will improve the accuracy of our countingÌýmethodology. BDUK is also investigating its vouchers’ data quality.ÌýÌý
8.5 Official StatisticsÌý
TheÌýBDUK Delivery Performance Statistics areÌýlabelled as official statistics and has been produced to the standards set out in the .Ìý
Our statistical practice is regulated by the Office for Statistical Regulation (OSR). OSR sets theÌýprinciplesÌýof trustworthiness,ÌýqualityÌýand value in the  Ìýthat all producers of official statistics should adhere to.Ìý
You are welcome to contact us directly with any comments about how we meet these standards by emailing statistics@bduk.gov.uk. Alternatively, you can contact OSR by emailing regulation@statistics.gov.ukÌýor via the .Ìý
8.6 Pre-releaseÌýaccessÌý
The accompanying pre-release access document lists ministers and officials who have received privilegedÌýearly accessÌýto this release. In line with best practice, the list has been kept to a minimum and those given access for briefing purposes had a maximum of 24 hours.Ìý
8.7 ContactÌý
Responsible Statistician: AÌýSÌýBhopal, Statistics and Data Intelligence Lead, Building Digital UK (BDUK) Directorate.Ìý
Author: M Zottoli, Senior Statistical OfficerÌý
Email:Ìýbduk.statistics@dsit.gov.ukÌý
Please contact us at the above email with any questions or suggestions for improvements.