Public electric vehicle charging infrastructure statistics: 1 April 2026
Published 21 May 2026

Ā© Crown copyright 2026
This publication is licensed under the terms of the Open Government Licence v3.0 except where otherwise stated. To view this licence, visit or write to the Information Policy Team, The National Archives, Kew, London TW9 4DU, or email: psi@nationalarchives.gov.uk.
Where we have identified any third party copyright information you will need to obtain permission from the copyright holders concerned.
This publication is available at /government/statistics/electric-vehicle-charging-infrastructure-statistics-1-april-2026/public-electric-vehicle-charging-infrastructure-statistics-1-april-2026
Visit theĀ electric vehicle charging infrastructure statisticsĀ collection page to browse the latest available statistics for electric vehicle charging in the United Kingdom.
About this release
This release presents statistics on publicly available electric vehicle chargingĀ infrastructureĀ in the United Kingdom.
Data is provided byā€ÆindividualĀ charge point operators (CPOs)Ā as set out in the Public Charge Point Regulations 2023 guidance ā€Æand collated by Zapmap for use by theā€ÆDepartment forĀ Transport (DfT).Ā The data presented in this releaseĀ is correct asĀ ofĀ 1Ā April 2026.
Further information can be found in the about these statistics section.
The next quarterly report is scheduled for release inĀ AugustĀ 2026.
Headline figures
As of 1 April 2026 there were 119,080 public EV chargers in the United Kingdom including 27,372 rated rapid or above (50kW+).
As of 1 January 2026, thisĀ statistical seriesĀ focuses onĀ publicly available ā€˜EV ³¦³ó²¹°ł²µ±š°ł²õā€™Ā (EVSE) in the United Kingdom, replacing the previous measure of ā€˜charging devicesā€™. More information about the introduction of EV charger statistics can be found in the frequently asked questionsĢż»å“Ē³¦³Ü³¾±š²Ō³Ł.
Chart 1: Number of public EV chargersĀ from January 2023Ā andĀ publicĀ charging devicesĀ from 2019: United Kingdom ()

Chart 1Ā is a line chartĀ presenting the number of public EV chargers in each quarter since January 2025,Ā and annualĀ industryĀ estimates since January 2023,Ā comparedĀ to the number of public charging devices in each quarter since October 2019.
The chartĀ shows thatĀ as of 1 April 2026:
-
there were 119,080 public EV chargersĀ compared toĀ 92,141 public charging devices
-
the growth rate of EV chargers over time has been comparable to the growth rate of charging devices
Chart 2: Cumulative growth of the public EV charger network per calendar year: United Kingdom, 2025 to present ()
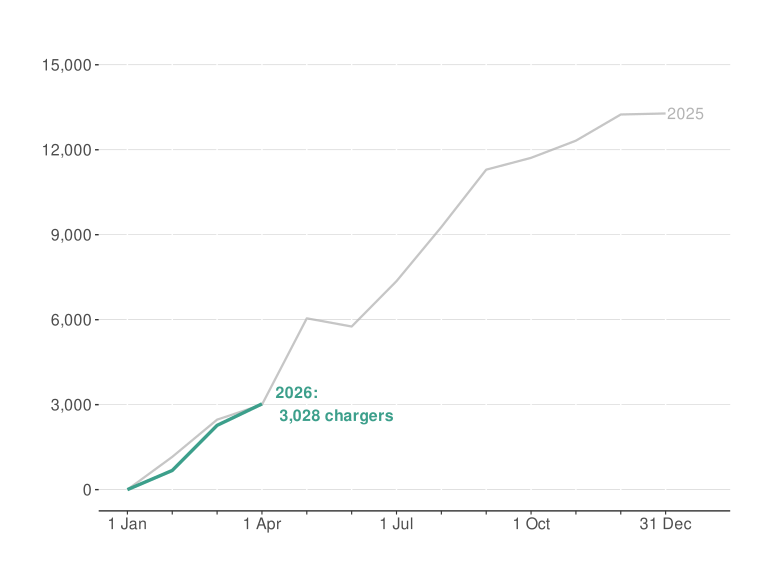
Chart 2 is a line chart showing the cumulative growth of the number of public EV chargers during each calendar year since 1 January 2025.Ā
The chart shows that, as of 1 April 2026:
-
3,028 EV chargers were added to the public network in the first quarter of 2026
-
13,281 were added to the public network in 2025
-
the increase in the number of public EV chargers in the first quarter of 2026 was similar to the equivalent period in 2025
Industry estimates provided by Zapmap indicate that:
-
24,557 EV chargers were added to the public network in 2024
-
20,662 were added to the public network in 2023
These estimates fall outside the scope of official statistics and do not appear in tables published on the page.
EV chargers by power rating
EV chargers are organised into power bands that reflect their typical useā€‘cases andĀ the different charging needs often required at differentĀ publicĀ locations.
EV chargers in higher power bands can charge vehiclesĀ more quickly.
Further information about power bandsĀ can be found in theĀ frequently asked questionsĢż»å“Ē³¦³Ü³¾±š²Ō³Ł.
In theĀ January 2026Ā edition of this series, DfTĀ introduced descriptiveĀ labelsĀ forĀ eachĀ EV chargerĀ powerĀ band toĀ facilitateĀ user understandingĀ and ease of reference.
TheĀ establishedĀ kilowatt (kW)Ā powerĀ bandsĀ have not changed fromĀ previousĀ DfTĀ statistical releases.
TheĀ powerĀ bandsĀ andĀ their newlyĀ associated labelsĀ asĀ used in these statisticsĀ are:
-
3kWĀ to less thanĀ 8kW:Ā standard
-
8kWĀ to less thanĀ 50kW:Ā standardĀ plus
-
50kWĀ to less thanĀ 150kW:Ā rapid
-
150kW and above:Ā ultra-rapid
DifferentĀ powerĀ bandsĀ and descriptive labelsĀ may beĀ usedĀ across the EV ³¦³ó²¹°ł²µ¾±²Ō²µĢż¾±²Ō»å³Ü²õ³Ł°ł²ā.
°ä³ó²¹°ł³ŁĢż3:Ģż±Ź³Ü²ś±ō¾±³¦ EV chargers byĀ powerĀ band: United Kingdom,Ā 1Ā April 2026Ā ()

°ä³ó²¹°ł³ŁĢż3Ā is a doughnut chartĀ presenting the percentage ofĀ publicĀ EV chargers in eachĀ power banding.
It shows thatĀ as of 1 April 2026:
-
50%Ģż“Ē“Ś EV chargersĀ were ratedĀ standardĀ (3kW to less than 8kW)
-
27% were ratedĀ standardĀ plusĀ (8kW to less than 50kW)
-
12% were ratedĀ rapidĀ (50kW to less than 150kW)
-
11% were ratedĀ ultra-rapidĀ (150kW and above)
³Ņ±š“Ē²µ°ł²¹±č³ó¾±³¦²¹±ōĢż»å¾±²õ³Ł°ł¾±²ś³Ü³Ł¾±“Ē²ŌĢż“Ē“ŚĢżEV chargers
°ä³ó²¹°ł³ŁĢż4:Ā Total andĀ 50kW and above (rapid or above) public EVĀ chargersĀ per 100,000 of the resident population,Ā by country and region: United Kingdom, 1 April 2026Ā ()

°ä³ó²¹°ł³ŁĢż4Ā is aĀ nestedĀ bar chartĀ comparing EV chargers per 100,000 of the resident population across United Kingdom countries and regionsĀ for both total and rapid or above EV chargers.
It shows thatĀ as of 1 April 2026:
-
regional variation is lower for rapid and above chargers than for total chargers
-
London has many more public chargers per capita than the rest of the United Kingdom,Ā yetĀ the secondā€‘lowest per capitaĀ rated rapid or above, as much of its public charging infrastructureĀ comprisesĀ standardĀ onā€‘streetĀ chargers
The regional distribution of EV chargers is similar to that of charging devices. Data for both metrics can be found on the page.
The figures used in chart 4 can be found in Annex A.
°ä³ó²¹°ł³ŁĢż5:Ģż±Ź³Ü²ś±ō¾±³¦ EV chargersĀ by rural urban classification: England and Wales, 1 April 2026Ā ()

°ä³ó²¹°ł³ŁĢż5Ā is a doughnut chartĀ comparing the percentage of EV chargers in rural and urban areas of England and WalesĀ according to theĀ .
It shows thatĀ as of 1 April 2026:
-
17.2% of EV chargers were in rural areas,Ā similar toĀ the proportion of the population of England and Wales that live inĀ rural areas (17.5%)
-
82.8% ofĀ EV chargersĀ were inĀ urban areas,Ā similar toĀ the proportion of the population of England and Wales that liveĀ in urban areasĀ (82.5%)
The rural and urban distribution of EV chargers is similar to that of charging devices. Data for both metrics can be found on the page.
EV chargers availableĀ forĀ different journey types
EV chargers areĀ grouped intoĀ location classificationsĀ thatĀ reflectĀ theĀ service they provideĀ forĀ variousĀ chargingĀ needsĀ andĀ journey types.
ā€˜D±š²õ³Ł¾±²Ō²¹³Ł¾±“Ē²Ōā€™Ā EV chargersĀ areĀ locatedĀ at the end of a journey or where a driver may stop for an extended period. This includesĀ chargers inĀ car parks and standard or standard plus chargers at hospitality premises.
ā€˜On streetā€™ EV chargers are typicallyĀ locatedĀ on residential streets and provide local public charging infrastructure.
ā€˜E²Ō-°ł“Ē³Ü³Ł±šā€™ EV chargers provide charging to continue journeys. This includes chargers at motorway service areas and rapid or above chargers at hospitality premises.
ā€˜Otherā€™Ā charging devices are semi-public with some level of access restrictions such as workplace car parks and dealership forecourts.
°ä³ó²¹°ł³ŁĢż6:Ģż±Ź³Ü²ś±ō¾±³¦ EV chargers by location classification: United Kingdom, 1 April 2026Ā ()

°ä³ó²¹°ł³ŁĢż6Ā is a doughnut chartĀ presenting the percentage ofĀ publicĀ EV chargers in each location classification.
It showsĀ thatĀ as of 1 April 2026:
-
52%Ā were classed as destinationĀ EV chargers
-
32%Ā were classed asĀ on-streetĀ EV chargers
-
11%Ā were classed asĀ en-routeĀ EV chargers
-
4% were classed as otherĀ EV chargers
TheĀ proportion ofĀ EV chargers inĀ someĀ locationĀ classesĀ areĀ slightly different to the proportionsĀ forĀ charging devices.Ā This is because the EV charger metricĀ allowsĀ more precise measurements of charging capability at these location classifications. Data for both metrics can be found on the page.
Parliamentary constituencies
Statistics onĀ EV chargers for each parliamentary constituency can be found on the page.
About these statistics
These statistics are released under the label. Official statistics in development are official statistics that are temporarily undergoing a development and are being tested with users, in line with the standards of trustworthiness, quality, and value in the Code of Practice for Statistics.
Please note that percentages may not always sum to 100 due to rounding.
Further information about these statistics can be found on the electric vehicle charging infrastructure statistics information page.
Annex
Annex A: Total andĀ 50kW and above (rapid or above) public EVĀ chargersĀ per 100,000 of the resident population,Ā by country and region: United Kingdom, 1 April 2026Ā ()
| Region | EV chargers per 100,000 population | 50kW and above (rapid or above) EV chargers per 100,000 population |
|---|---|---|
| United Kingdom | 171.9 | 39.5 |
| North East | 144.4 | 34.4 |
| North West | 108.3 | 37.9 |
| Yorkshire and the Humber | 110.2 | 34.7 |
| East Midlands | 123.7 | 44.2 |
| West Midlands | 162.6 | 43.3 |
| East of England | 150.3 | 46.2 |
| London | 340.0 | 27.0 |
| South East | 153.0 | 37.3 |
| South West | 153.9 | 46.4 |
| Wales | 179.3 | 39.6 |
| Scotland | 228.5 | 57.2 |
| Northern Ireland | 59.4 | 18.4 |