UK regional trade in goods statistics, fourth quarter, October to December 2023: commentary
Published 14 March 2024

© Crown copyright 2024
This publication is licensed under the terms of the Open Government Licence v3.0 except where otherwise stated. To view this licence, visit or write to the Information Policy Team, The National Archives, Kew, London TW9 4DU, or email: psi@nationalarchives.gov.uk.
Where we have identified any third party copyright information you will need to obtain permission from the copyright holders concerned.
This publication is available at /government/statistics/uk-regional-trade-in-goods-statistics-fourth-quarter-october-to-december-2023/uk-regional-trade-in-goods-statistics-fourth-quarter-october-to-december-2023-commentary
The RTS fourth quarter (October to December) 2023 publication includes as announced on 12th December 2023.
These changes are in accordance with those made to , where more details on the corrections made can be found.
Regional trade in goods summary
This commentary reports the UK’s regional trade in goods statistics by broad area (EU and non-EU), Country and Standard International Trade Classification (SITC) Revision 4. Users must refer to the explanatory notes accompanying this commentary, covering data sources and compilation methodology. Aggregated data can be found in our accompanying tables.
Please note that trade in goods values are in current prices. Figures are not adjusted for inflation or global economic events, so please take caution when making comparisons with historic data.
In the year ending December 2023, the overall value of UK trade in goods decreased by 2.3% for exports and by 5.4% for imports, when compared with the previous year. At a regional level:
- all UK countries experienced a decrease in the value of exports, except for Northern Ireland which increased
- all UK countries experienced a decrease in the value of imports, except for Northern Ireland which increased
- export values for the North East, East Midlands, West Midlands, and South West increased while all other English regions experienced decreases
- import values decreased for all English regions, except for the East Midlands and East
England’s trade in goods
In the year ending December 2023, compared with the year ending December 2022:
England’s goods exports to EU countries were worth £128 billion (bn) (down £5.7bn, 4.3%). The largest decrease in EU exports was in SITC 33 - Petroleum, petroleum products & related materials (down £4.3bn, 30%). The largest decrease in EU exports was to the Netherlands (down £5.3bn, 22%).
England’s goods exports to non-EU countries were worth £135bn (up £1.1bn, 0.8%). The largest increase in non-EU exports was in SITC 71 - Power generating machinery & equipment (up £4.9bn, 31%). The largest increase in non-EU exports was to the USA (up £2.0bn, 4.9%).
In the year ending December 2023, the largest English export region was the South East, accounting for 11% of the UK’s total goods exports, whilst the smallest was the North East, accounting for 3.7%.
England’s goods imports from EU countries were worth £247bn (up £8.2bn, 3.4%). The largest increase in EU imports was in SITC 78 - Road vehicles (including air cushion vehicles) (up £8.5bn, 21%). The largest increase in EU imports was from France (up £5.3bn, 19%).
England’s goods imports from non-EU countries were worth £203bn (down £33.8bn, 14%). The largest decrease in non-EU imports was in SITC 34 - Gas, natural & manufactured (down £19.6bn, 58%). The largest decrease in non-EU imports was from Norway (down £11.0bn, 41%).
In the year ending December 2023, the largest English import region was the South East, accounting for 19% of the UK’s total goods imports, whilst the smallest was the North East, accounting for 2.6%.
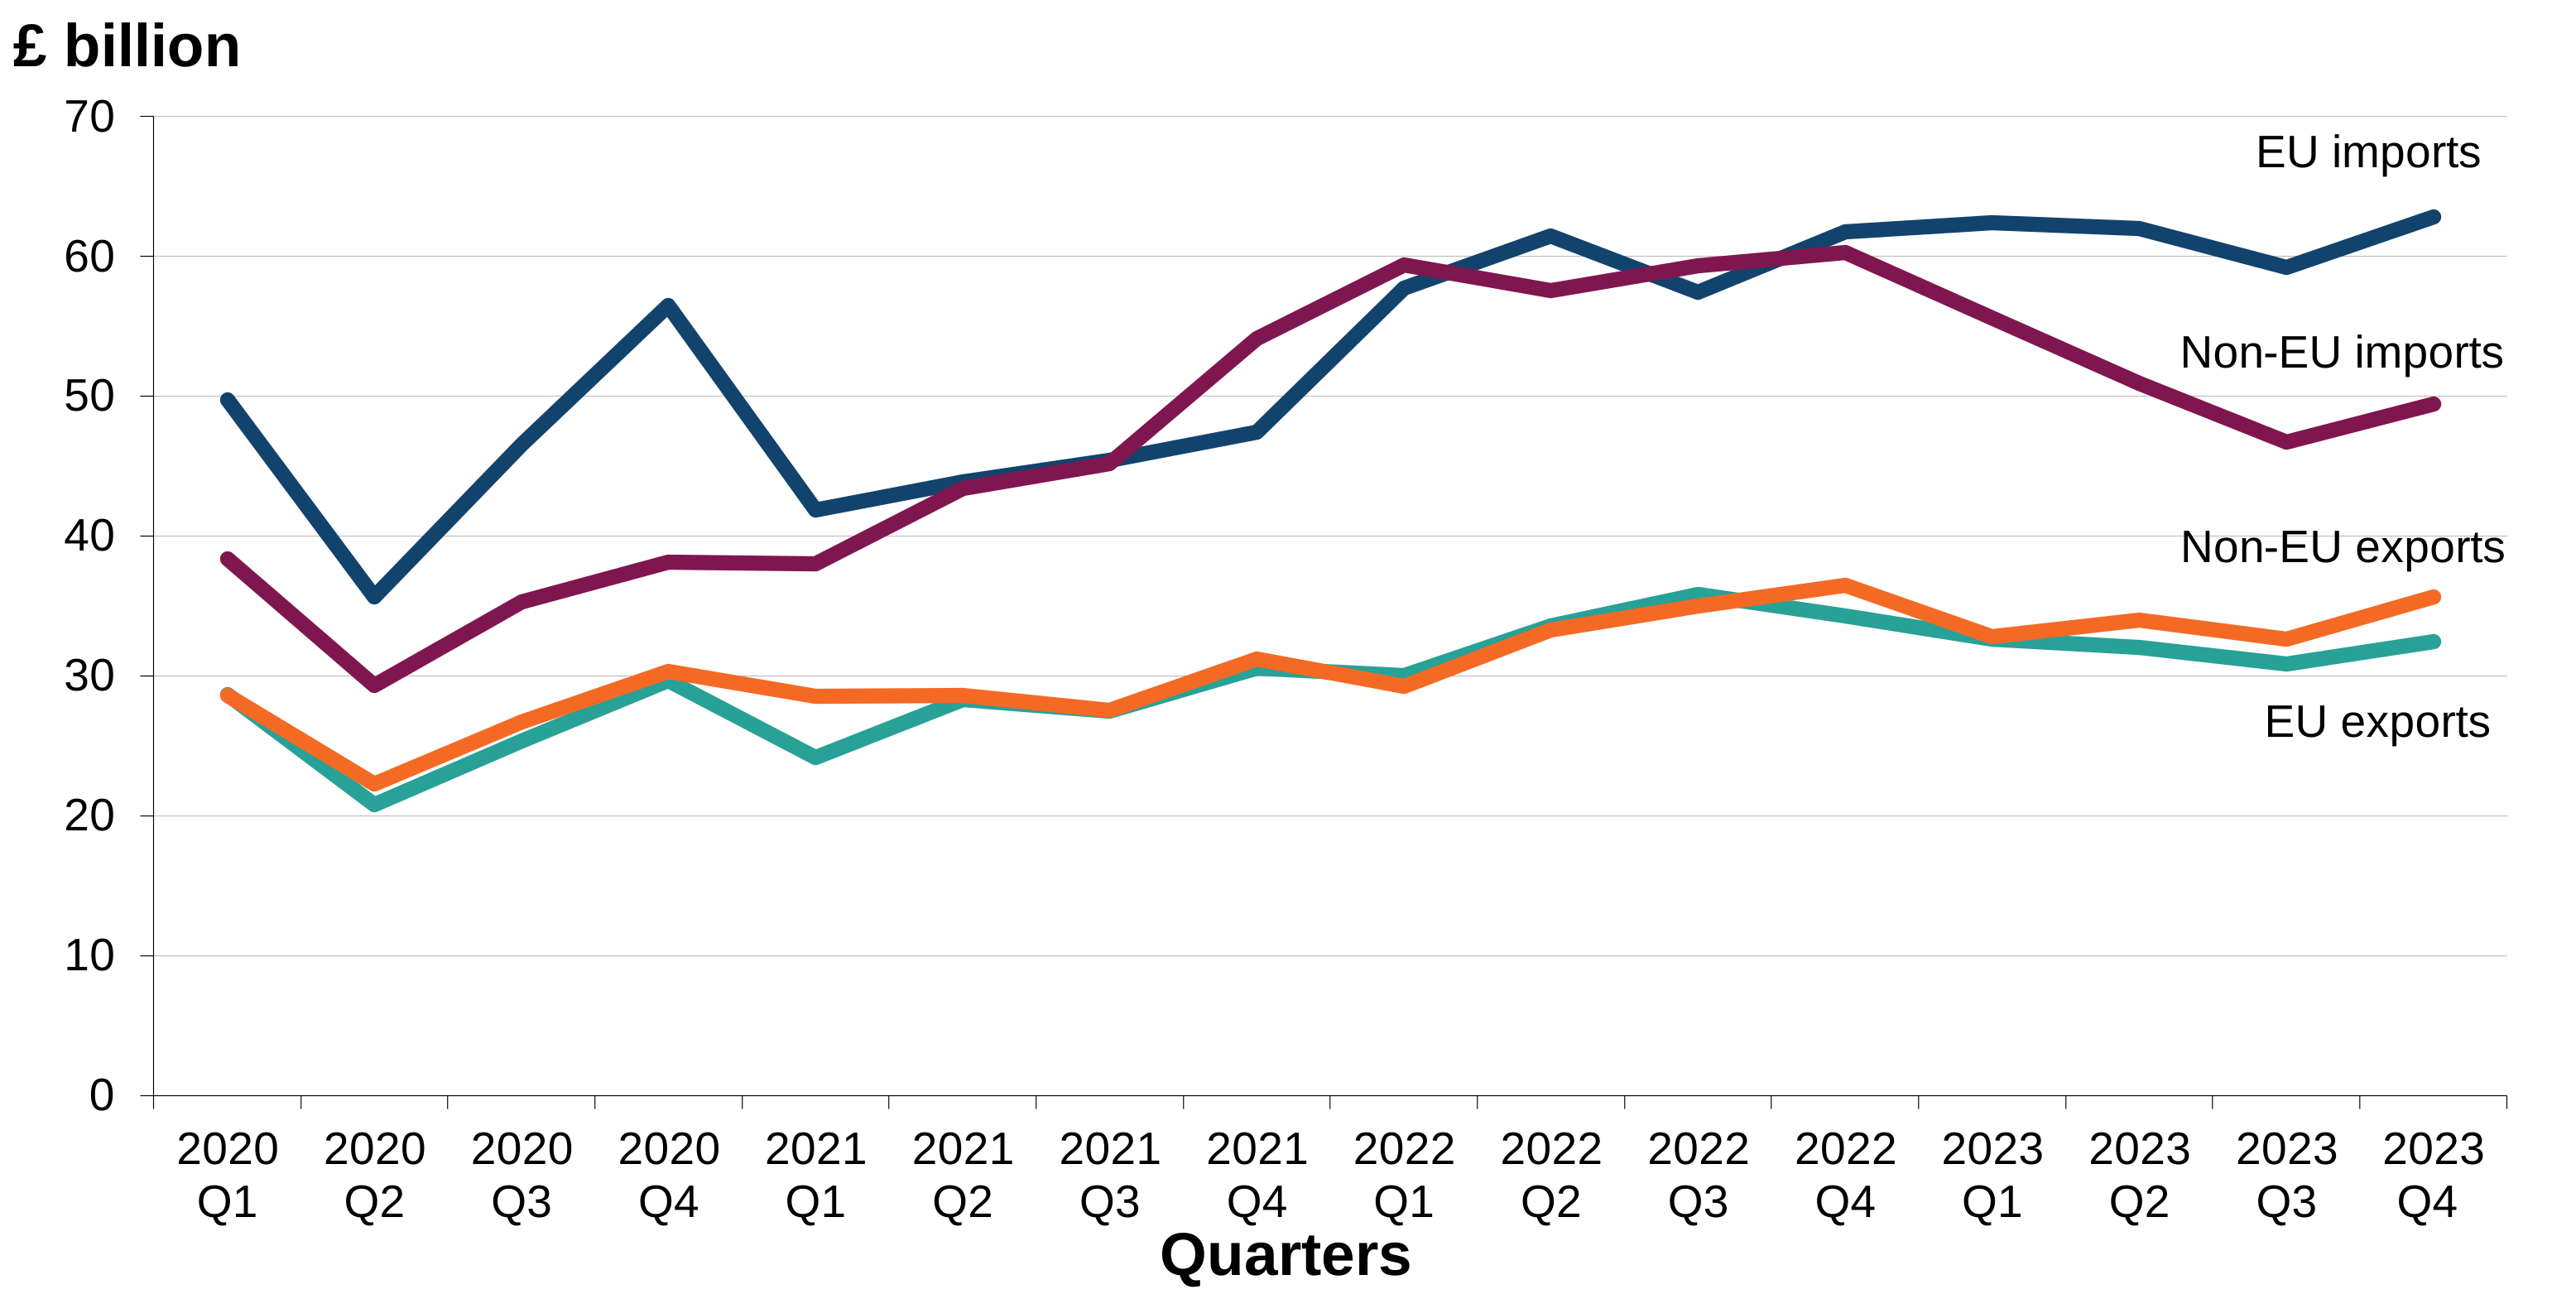
Figure 1: England’s goods trade, Quarter 1 (Jan to Mar) 2020 onwards
Source: HM Revenue & Customs Regional trade in goods statistics
Note: 2023 data is provisional
Figure 1 shows a time series of England’s goods trade with EU and non-EU countries, for both exports and imports:
-
the value of non-EU exports and EU imports had overall increasing trends when comparing the year ending December 2023 with the previous year, whereas EU exports and non-EU imports had overall decreasing trends
-
the value of all four flows experienced a quarterly increase in the fourth quarter of 2023, for the first time since the fourth quarter of 2021
-
the value of EU and non-EU imports are larger than the value of both EU and non-EU exports throughout the time series
Wales’s trade in goods
In the year ending December 2023, compared with the year ending December 2022:
Wales’ goods exports to EU countries were worth £11.5bn (a small decrease, down 0.1%). The largest decrease in EU exports was in SITC 33 - Petroleum, petroleum products & related materials (down £0.4bn, 19%). The largest decrease in EU exports was to Ireland (down £0.4bn, 14%).
Wales’ goods exports to non-EU countries were worth £7.9bn (down £1.1bn, 12%). The largest decrease in non-EU exports was in SITC 33 - Petroleum, petroleum products & related materials (down £0.8bn, 36%). The largest decrease in non-EU exports was to the USA (down £0.5bn, 13%).
Wales’ goods imports from EU countries were worth £7.7bn (down £0.4bn, 4.9%). The largest decrease in EU imports was in SITC 35 - Electric current (down £0.2bn, 88%). The largest decrease in EU imports was from Ireland (down £0.4bn, 55%).
Wales’ goods imports from non-EU countries were worth £13.6bn (down £2.4bn, 15%). The largest decrease in non-EU imports was in SITC 33 - Petroleum, petroleum products & related materials (down £1.6bn, 23%). The largest decrease in non-EU imports was from Japan (down £0.4bn, 55%).
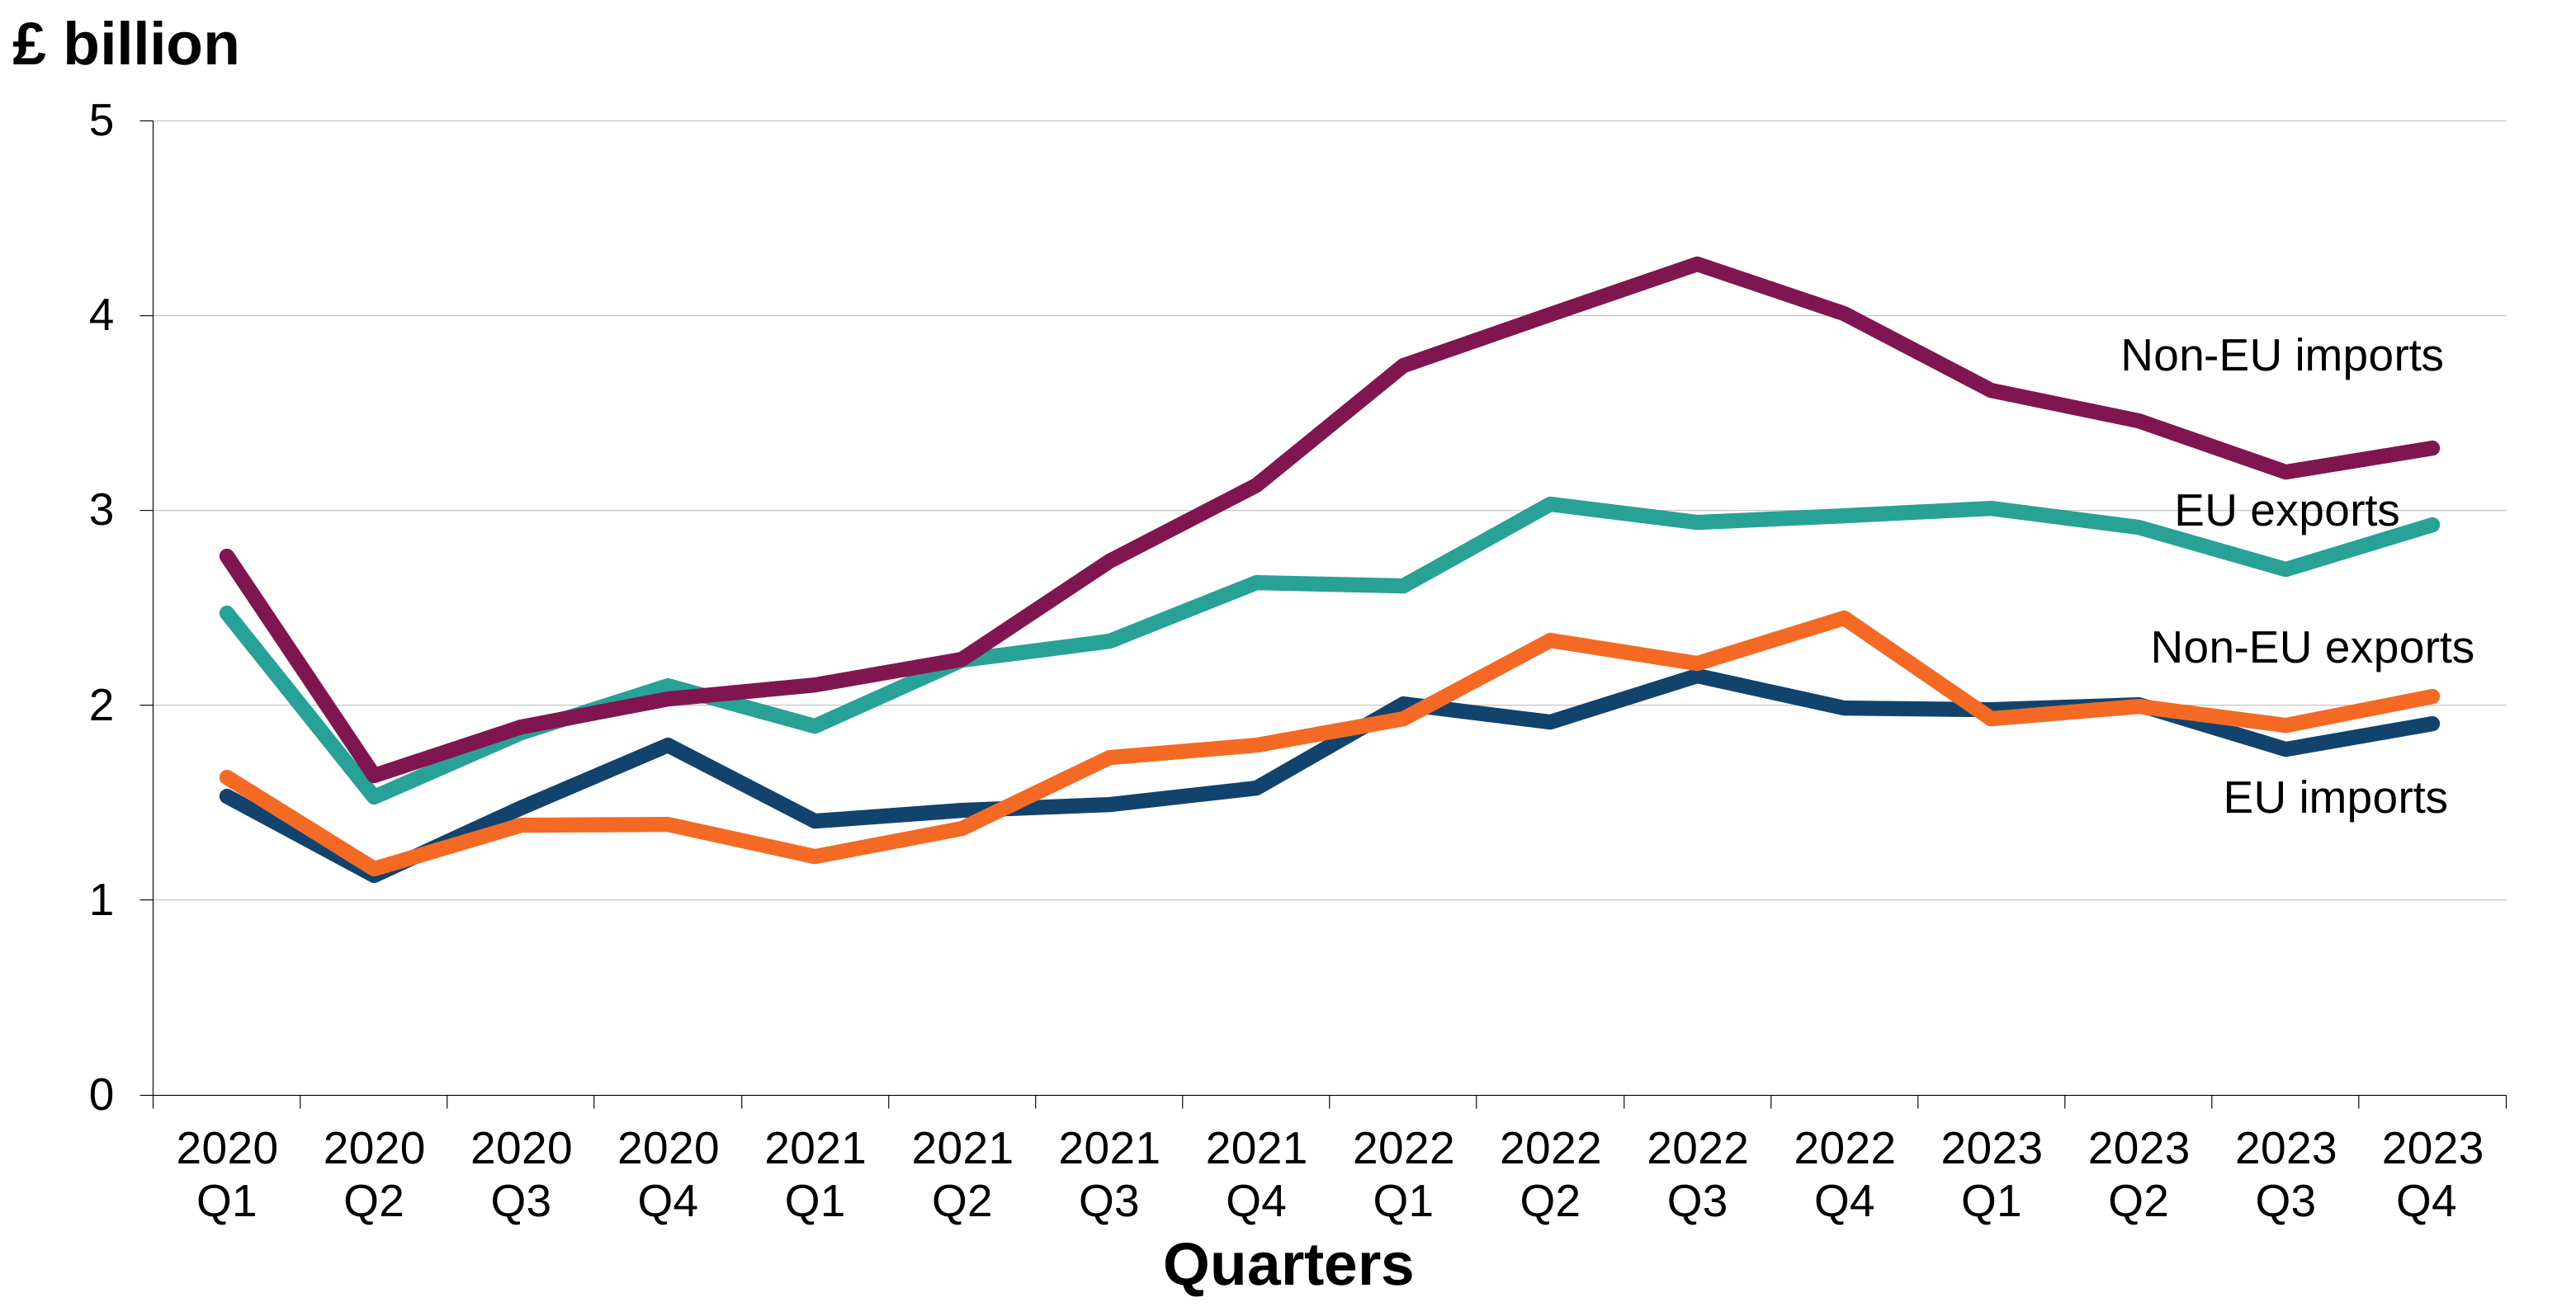
Figure 2: Wales’ goods trade, Quarter 1 (Jan to Mar) 2020 onwards
Source: HM Revenue & Customs Regional trade in goods statistics
Note: 2023 data is provisional
Figure 2 shows a time series of Wales’ goods trade with EU and non-EU countries, for both exports and imports:
- focusing on the last 2 years, Wales’ goods exports to EU countries remained flat while non-EU exports, EU and non-EU import flows showed declining trends
- the value of all four flows experienced a quarterly increase in the fourth quarter of 2023, for the first time since the fourth quarter of 2021
- the value of EU exports has exceeded the value of EU imports throughout the time series, making Wales a net exporter to the EU
Scotland’s trade in goods
In the year ending December 2023, compared with the year ending December 2022:
Scotland’s goods exports to EU countries were worth £19.1bn (down £2.5bn, 12%). The largest decrease in EU exports was in SITC 34 - Gas, natural & manufactured (down £1.7bn, 51%). The largest decrease in EU exports was to Ireland (down £1.6bn, 41%).
Scotland’s goods exports to non-EU countries were worth £14.2bn (down £0.5bn, 3.3%). The largest decrease in non-EU exports was in SITC 68 - Non-ferrous metals (down £0.6bn, 73%). The largest decrease in non-EU exports was to India (down £0.2bn, 28%).
Scotland’s goods imports from EU countries were worth £12.3bn (up £0.5bn, 3.9%). The largest increase in EU imports was in SITC 71 - Power generating machinery & equipment (up £0.3bn, 35%). The largest increase in EU imports was from France (up £0.4bn, 29%).
Scotland’s goods imports from non-EU countries were worth £17.6bn (down £7.1bn, 29%). The largest decrease in non-EU imports was in SITC 34 - Gas, natural & manufactured (down £5.9bn, 55%). The largest decrease in non-EU imports was from Norway (down £4.8bn, 48%).
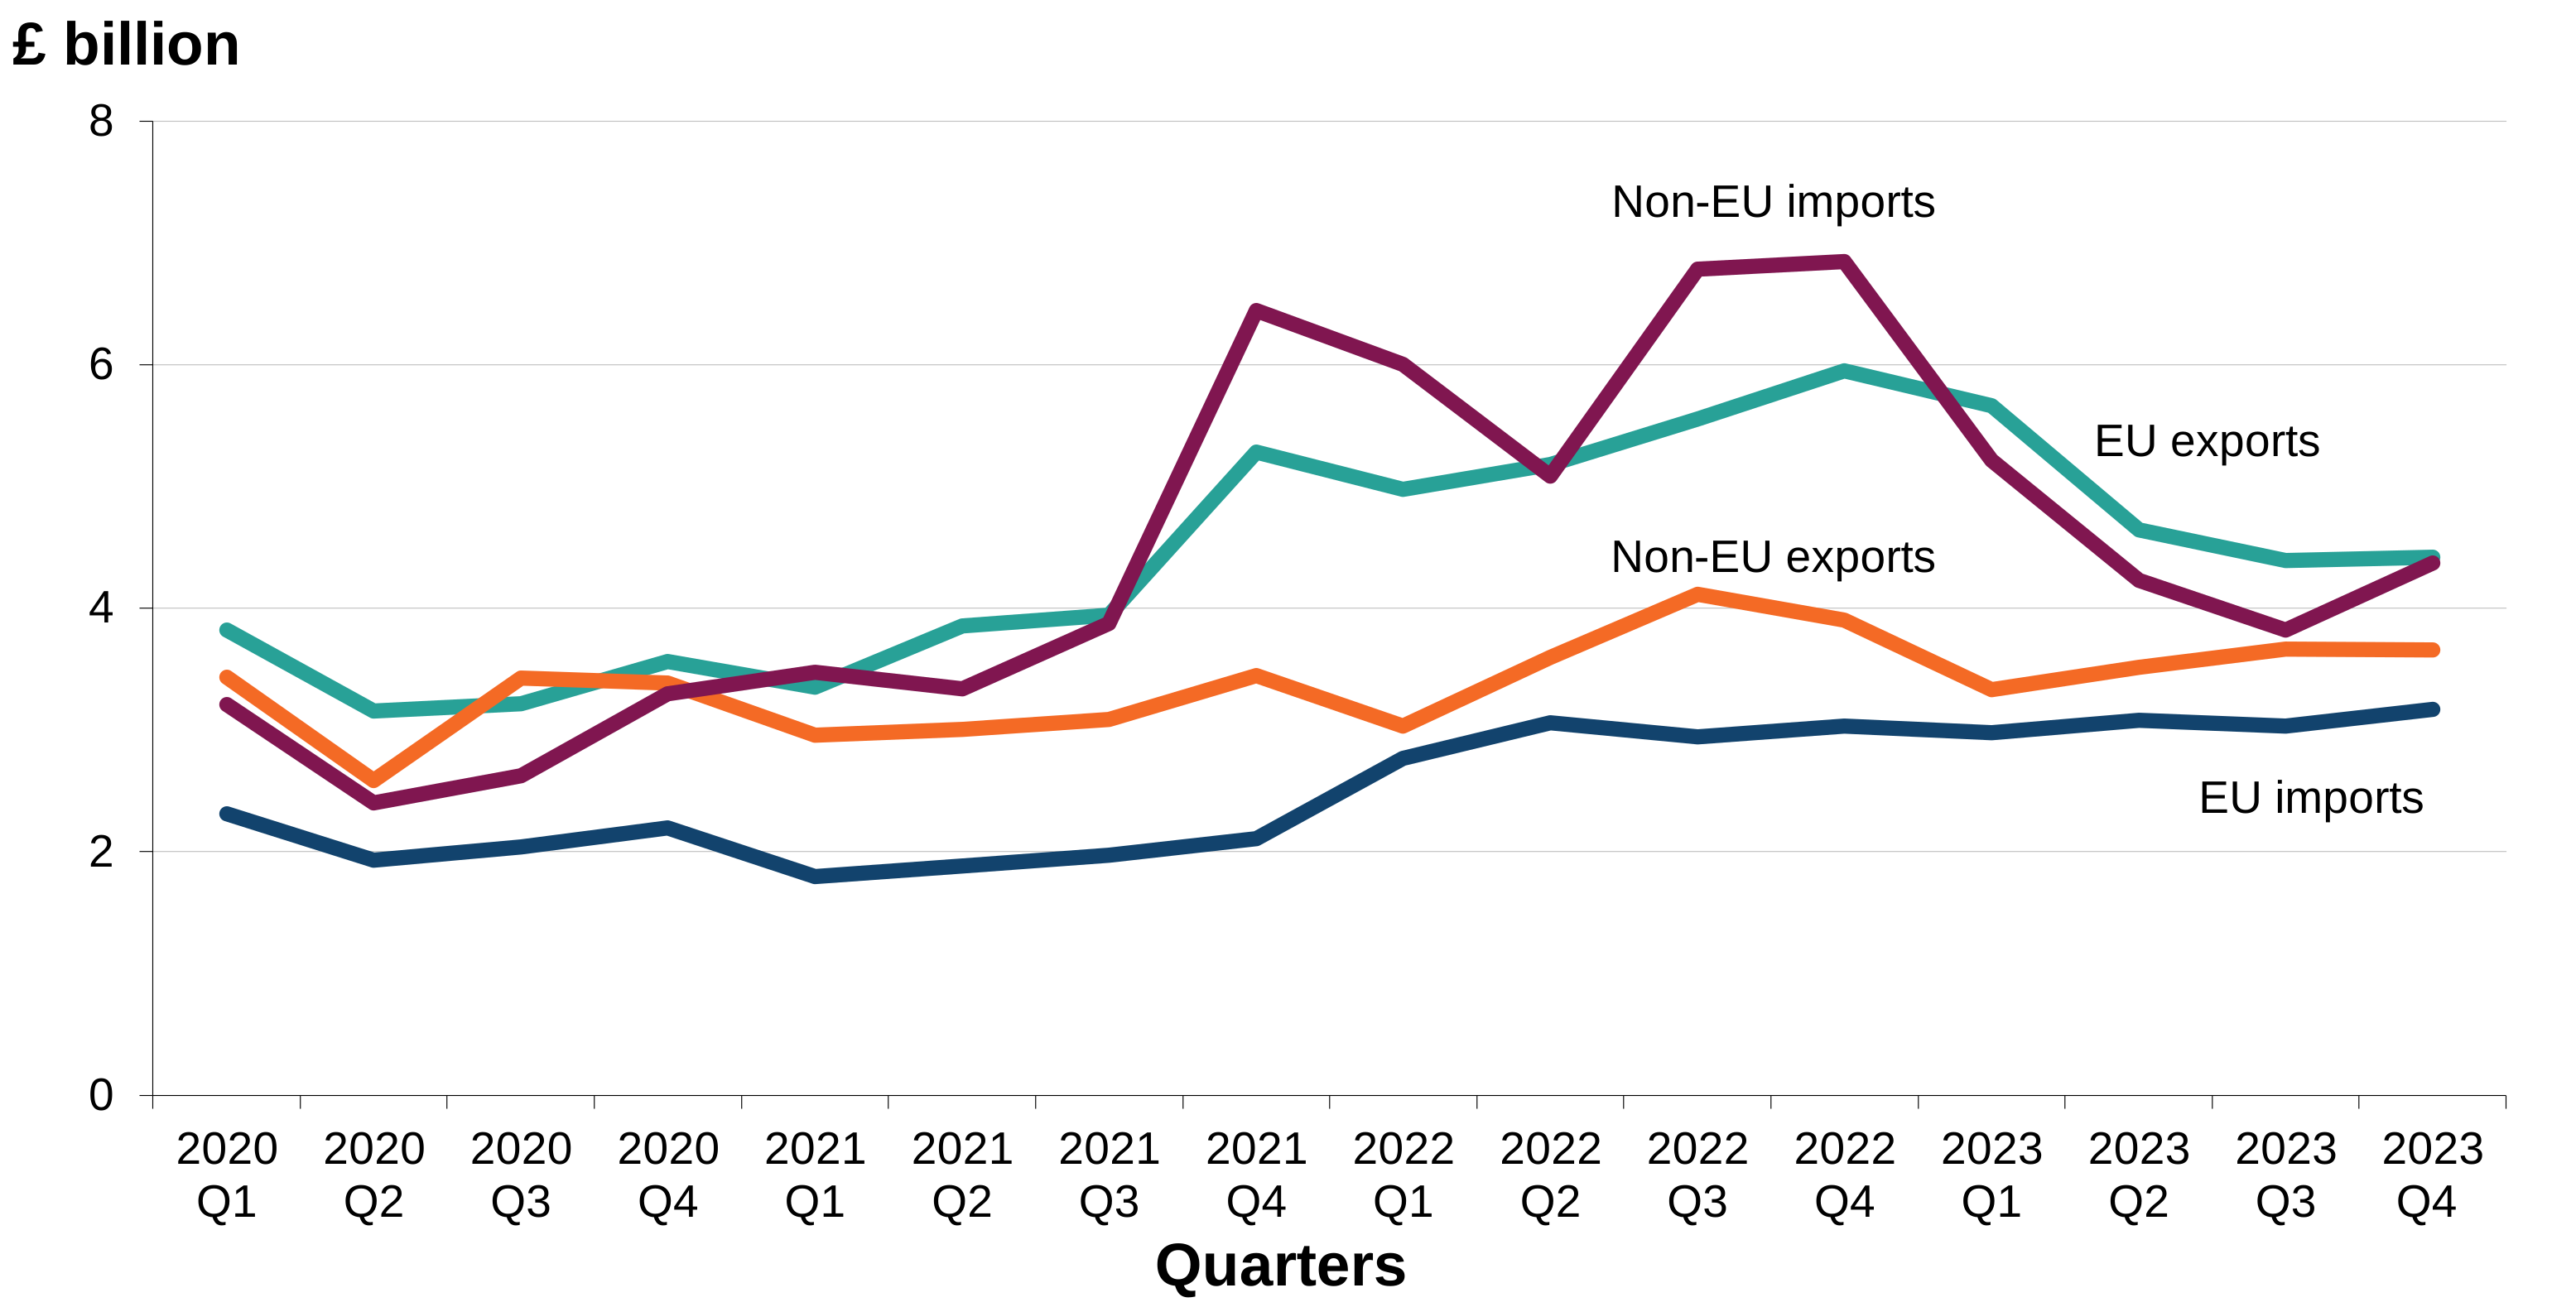
Figure 3: Scotland’s goods trade, Quarter 1 (Jan to Mar) 2020 onwards
Source: HM Revenue & Customs Regional trade in goods statistics
Note: 2023 data is provisional
Figure 3 shows a time series of Scotland’s goods trade with EU and non-EU countries, for both exports and imports:
- focusing on the last 2 years, Scotland’s EU export and non-EU import flows showed clear declining trends while non-EU export and EU import flows showed slightly upward trends
- scotland’s goods import value from non-EU countries experienced a noticeable increase in the fourth quarter of 2023
- since the fourth quarter of 2020, the value of EU exports has exceeded the value of non-EU exports consistently
Northern Ireland’s trade in goods
In the year ending December 2023, compared with the year ending December 2022:
Northern Ireland’s goods exports to EU countries were worth £6.8bn (up £0.8bn, 13%). The largest increase in EU exports was in SITC 66 - Non-metallic mineral manufactures n.e.s. (up £0.2bn, more than 2.5 times the value). The largest increase in EU exports was to Ireland (up £0.3bn, 7.0%).
Northern Ireland’s goods exports to non-EU countries were worth £4.0bn (up £0.8bn, 23%). The largest increase in non-EU exports was in SITC 54 - Medicinal & pharmaceutical products (up £0.3bn, 75%). The largest increase in non-EU exports was to the USA (up £0.5bn, 46%).
Northern Ireland’s goods imports from EU countries were worth £6.6bn (up £0.1bn, 0.8%). The largest increase in EU imports was in SITC 01 - Meat & meat preparations (up £0.1bn, 22%). The largest increase in EU imports was to Germany (up £0.1bn, 15%).
Northern Ireland’s goods imports from non-EU countries were worth £3.0bn (a minimal increase). The largest increase in non-EU imports was in SITC 77 - Electrical machinery, apparatus & appliances n.e.s (up £0.1bn, 44%). The largest increase in non-EU imports was from the USA (up £0.2bn, 31%).
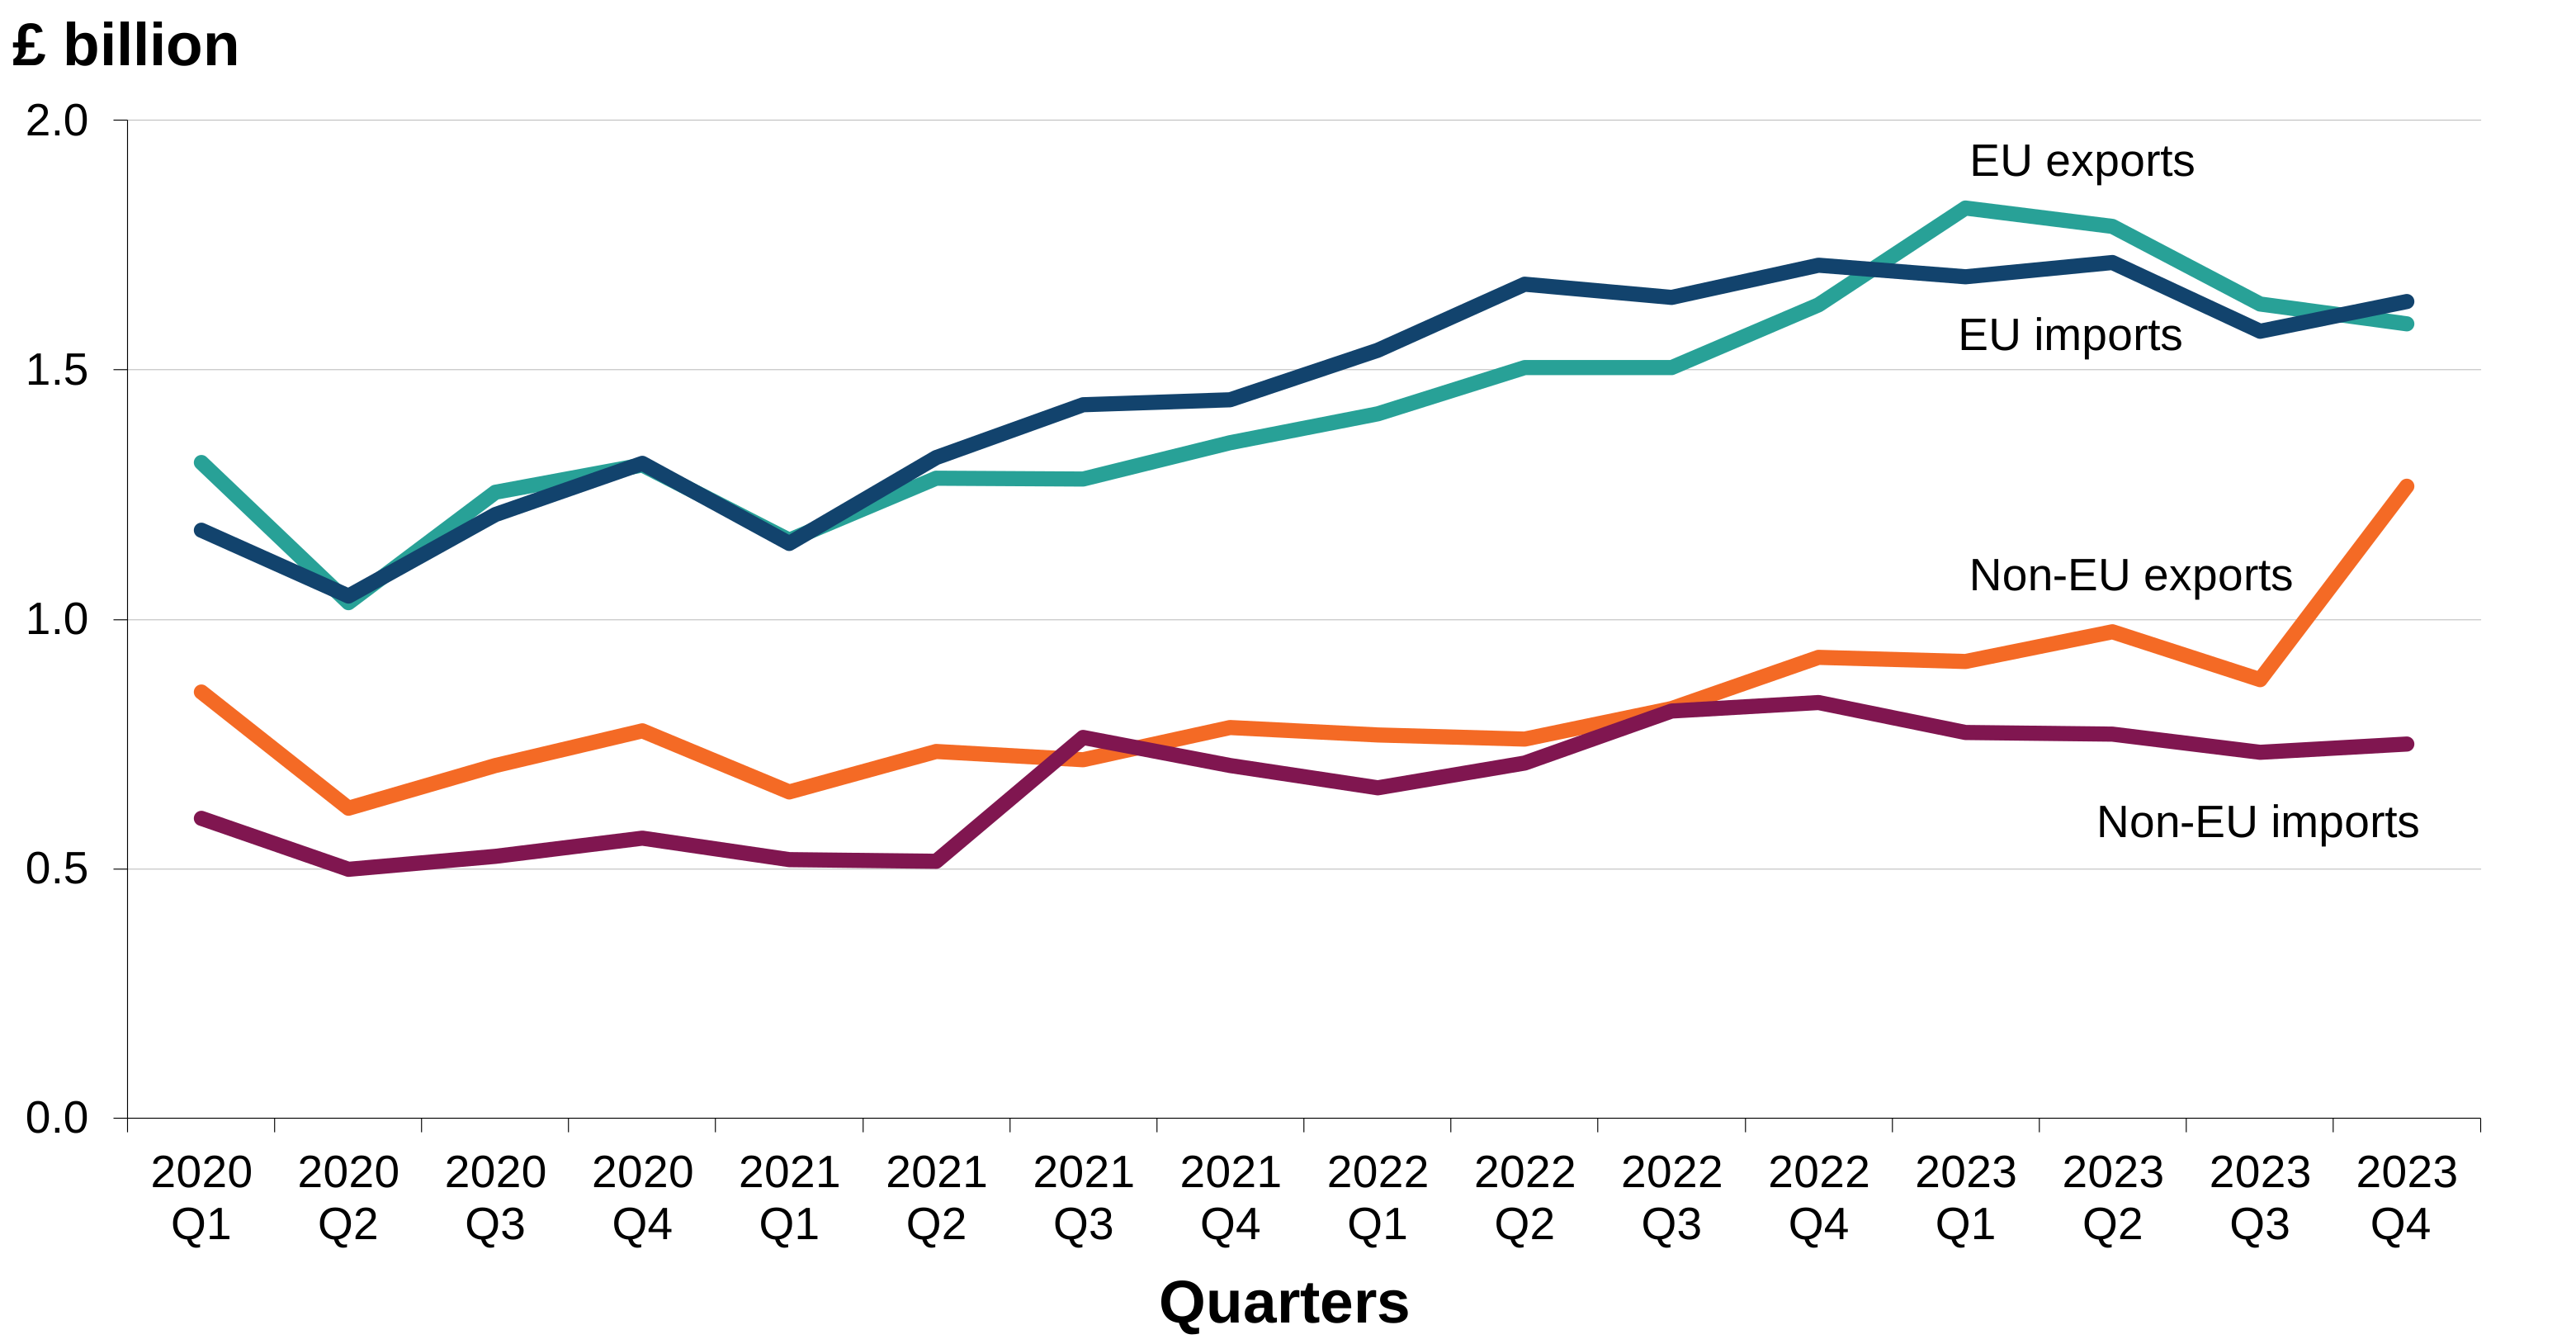
Figure 4: Northern Ireland’s goods trade, Quarter 1 (Jan to Mar) 2020 onwards
Source: HM Revenue & Customs Regional trade in goods statistics
Note: 2023 data is provisional
Figure 4 shows a time series of Northern Ireland’s goods trade with EU and non-EU countries, for both exports and imports:
-
the value of all four goods flows had an overall increasing trend when comparing the year ending December 2023 with the previous year
-
northern Ireland’s goods export value to non-EU countries had a noticeable increase since the third quarter of 2023, peaking in the fourth quarter of 2023
-
throughout the time series, Northern Ireland’s goods trade value with EU countries has been higher than its goods trade with non-EU countries