Port freight statistics: Notes and definitions
Published 29 July 2026

© Crown copyright 2026
This publication is licensed under the terms of the Open Government Licence v3.0 except where otherwise stated. To view this licence, visit or write to the Information Policy Team, The National Archives, Kew, London TW9 4DU, or email: psi@nationalarchives.gov.uk.
Where we have identified any third party copyright information you will need to obtain permission from the copyright holders concerned.
This publication is available at /government/statistics/port-freight-annual-statistics-2025/port-freight-statistics-notes-and-definitions
Ìý IntroductionÌý
Department for Transport statistics on UK port traffic are published in two stages: (1) provisional quarterly releases, published 10 weeks after the end of the quarter. (2) more detailed final annual release published in summer of the following year.ÌýÌý
All port freight statistics are published through the maritime and shipping series on the DfT statistics webÌýpage.ÌýÌý
Purpose and usageÌý
These statistics relate to freight traffic to and from ports in the United Kingdom. They provide an overview of patterns and trends in cargo handled by ports which inform the work of the Department for Transport (DfT) Maritime Directorate, as well as others with an interest such as industry stakeholder organisations,ÌýacademicsÌýand researchers. The statistics were used to fulfil Eurostat reporting requirements under the Maritime Statistics Directive, which will continue toÌýmaintainÌýa consistent time series and allow comparisons with other countries.ÌýÌý
This document outlines the coverage of these statistics, including information on data sources and processingÌýmethodologyÌýas well as changes which have occurred to both methods and published outputs.ÌýÌý
For more detailed information about the quality of the statistics, users and uses and responses to user feedback, please see the accompanying Port Freight statistics: Background QualityÌýReport.
DefinitionsÌý
Ports coveredÌý
These statistics relate to freight traffic to and from ports in the United Kingdom, unless otherwiseÌýstated, and do not cover ports in the Isle of Man or the Channel Islands.Ìý
Major and minorÌýports. From 2000, major ports are those with cargo volumes of at least 1 million tonnes annually. There are in some years a small number of ports with less tonnage who have either just fallen below the threshold, are showing a trend that they will exceed 1 million tonnes within aÌýyear, orÌýhave previously handled more than 1 million tonnes of cargo in a year. Prior to 2000 the threshold for ‘major’ ports was 2 million tonnes of cargo annually.ÌýÌý
More detailed data are collected for major ports than for the remaining ‘minor’ ports. All tables starting PORT01 have been supplemented by estimated breakdowns of the minor port traffic.Ìý
Cargo classification
CargoÌýtypes. Major port traffic is classified by cargo type, which isÌýthe means by whichÌýgoods are loaded onto or of the vessel. Although for some cargo types there is further subdivision into broad commodities, the method of loading takes priority.
Weights. All weightsÌýstatedÌýare tonnes gross, including crates and other packaging. The tare weights of containers, road goods vehicles,ÌýtrailersÌýand other items of transport equipment (for example,Ìýthe unloaded weight of the vehicle or equipment itself) are excluded.ÌýÌý
UnitisedÌýgoods. Goods which are lifted on or of the vessel in large (20 foot or longer) shippingÌýcontainers, orÌýrolled on or off in one of a variety of self-propelled or towed units are said to be unitised cargoes. For these cargo types, the number of units as well as the weight of goods is recorded.ÌýÌý
Main freightÌýunits. A subset of unitised goods are main freight units – this group consists of all containers and those Ro-Ro units which are designed to carry freight (categories 51, 61 and 63 in theÌý).ÌýThe purpose of the main freight unit classification is that it excludes those Ro-Ro units which are not freight carrying –Ìýsuch asÌýpassenger vehicles, trade vehicles, and other specialised vehicles and trailers.ÌýÌý
ContainerÌýtraffic.ÌýFor the purpose ofÌýmaritime statistics, the classification of containers is based purely upon their length as shown in the table. TEU (twenty-foot equivalent units) is a standardised measure to allow for theÌýdifferent sizesÌýof container boxes. Containers carried on board Ro-Ro vessels by shipborne port-to-port trailers are not included from 2000 onwards, although some operators incorrectly continued to include them until 2004.
| ÌýSizeÌý | ÌýTEUÌý | Ìý |
| 20ft | 1 | Ìý |
| 40ft | 2 | Ìý |
| >20ft & <40ft | 2.5 | Ìý |
| >40ft | 2.25 | Ìý |
Vessel informationÌýÌý
Several of the data tables provide a breakdown by vessel characteristics.ÌýÌý
In table PORT0604 nationality refers to the nationality of the parent owner of the carrying vessel. In table PORT0605 the flag denotes the country authorising the registry of the vessel. For more information on shipping fleets, see the latest Shipping Fleet StatisticsÌýtables.
Geographical breakdownÌýÌý
UK port traffic is classified geographically according to where the goods were last loaded or next unloaded at the other end of the sea journey. All traffic is either domestic or eitherÌýÌýinternational.ÌýDomestic traffic is eitherÌýcoastwiseÌýorÌýone-port. ÌýInternational traffic is eitherÌýshort sea orÌýdeep sea,Ìýand short sea traffic may be further divided according toÌýwhether or notÌýit is with another EU member state. A more detailed description of these terms is given in theÌýtable below.Ìý
Geographical classification of UK port traffic:Ìý
| Domestic/International | Traffic Type | Region | Note |
|---|---|---|---|
| Domestic | Coastwise | Coastwise | Traffic between ports in the United Kingdom (and with the Isle of Man and the Channel Islands). The totals of inwards and outwards coastwise traffic, however, do not match exactly. This is mainly because traffic between major and minor ports, or between major ports and ports in the Isle of Man and the Channel Islands, are not recorded at both ends (as is the case with coastwise traffic between major ports), but only at the major port end |
| Domestic | One-port | One-port | Dredged sand, gravel and other similar cargo, landed at a port for commercial purposes; and traffic to and from UK offshore oil and gas installations (traffic with non-UK offshore oil and gas installations is recorded as foreign traffic). Formerly also included material shipped for dumping at sea, until this practice ceased |
| International | Short sea | EU (as at 1 July 2013) | Traffic with Belgium, Bulgaria, Cyprus, Denmark (including Faroe Islands), Croatia, Estonia, Finland, France, Germany, Greece, Italy, Latvia, Lithuania, Malta, Netherlands, Poland, Portugal (including Madeira and Azores), Republic of Ireland, Romania, Spain (including the Canary Islands), Slovenia, Sweden |
| International | Short sea | Other Europe and Mediterranean | Traffic with Albania, Algeria, Azerbaijan, Croatia, Egypt, Georgia, Gibraltar, Iceland, Israel, Lebanon, Libya, Monaco, Morocco, Norway, Russia, Syria, Tunisia, Turkey, Ukraine |
| International | Deep sea | Rest of world | Traffic with all countries of Africa (excluding Mediterranean countries), America (both North and South America), Asia (excluding Mediterranean and Black Sea countries) and Australasia |
Data collection and processingÌýÌý
Information for shipping lines, theirÌýagentsÌýand ports to complete statistical returns on maritime freight traffic through UK ports. The legal powers to collect these data areÌýby means ofÌýa   (number 2330 of 1997) under section 2(2) of the European Communities Act 1972. The Maritime Statistics Directive is a piece of European Union legislation passed in December 1995 Council Directive 96/64/EC which requires Member States to supply to the Statistical Office of the European Communities (Eurostat) information relating to maritime traffic through its’ ports. The directive requires the government to make collection obligatory in the United Kingdom. The  in 2009, bringing together the original directive and variousÌýsubsequentÌýamendments in one document. The legal powers in the UK areÌýby means ofÌýa  (number 2330 of 1997) under section 2(2) of the European Communities Act 1972.Ìý
Additionally, tables PORT0601 and PORT0602 provide information on vessels arriving at UK ports. These are compiled from a range of data sources (outlined below).ÌýÌý
The port freight data tables also include information on domestic waterborne freight (DWF) in tables PORT0701 – PORT0705; this is based on re-analysis of information from the port freight system and additional information on inland waterway movements. Key differences are summarised inÌýbelow, with further details in the separate notes and definitions document for DWF.Ìý
Port freight statisticsÌý
DataÌýcollection. Data are collected from major ports and shipping lines and agents, on a quarterly basis, and from minor ports annually -Ìýin accordance withÌýthe Directive. Data providers canÌýsubmitÌýreturns online using the Department’s ‘submitÌýmaritime statistics’ website or in fat file format. Full details - including collection forms,ÌýinstructionsÌýand code lists - are available in the guidance for dataÌýproviders.Ìý
From 2019, DfT collate the data, carry outÌýinitialÌývalidation checks,Ìýand alsoÌýoperateÌýa helpdesk toÌýidentifyÌýand follow up non-respondents (prior to 2019, this process was managed by a separate collection agency). At the end of each quarter and year,ÌýadditionalÌýchecks are carried out, including the cross-comparison of port and agent records, and comparisons withÌýpreviousÌýtime periods. Major anomalies are followed up with data providers. Further details of the collection and the quality assurance carried out, and strengths and limitations of the data, can be found in the separate background qualityÌýreport (BQR).ÌýÌý
CompilationÌýmethodology. Published figures are based on annual totals by cargo type and direction provided by ports.ÌýÌý
From 2000 all freight estimates shown in the tables which have a geographic element (for example,Ìýimports, exports, foreign, domestic traffic) have been estimated by grossing procedures based on information supplied by shipping lines and agents. Port figures are used as control totals, and figures from agents are grossed to port totals on annual basis to provide a breakdown by route and vessel information which is not collected from ports. Further details of this grossing are given in the BQR.ÌýÌý
Before 2000, this information has been estimated by ports but only approximately in many cases. The post-2000 collection arrangements provide more reliable geographic information,Ìýfor example,Ìýestimates of imports, exports, foreign, coastwise, one-port traffic, traffic on individual routes, etc.
Ship arrivals statisticsÌý
The PORT0601 and PORT0602 data tables present statistics on the number of arrivals of commercial cargo and passenger ships at UK ports. These statistics are basedÌýlargely onÌýdifferent sourcesÌýof data to the statistics on cargo handled obtained through the port freight collection system described above.ÌýÌý
The data are considered a reasonablyÌýaccurateÌýestimate of the number of commercial shipping movements at UK ports, but are not necessarily exact, and the coverage of certain vessel or traffic types may be variable at the margins. Consequently, these data are not classified as NationalÌýStatistics.ÌýÌý
The methods for compiling the statistics were substantially revised for 2010 data (and 2009 was also re-cast on the new basis, so that 2009 estimates are available on both bases for comparison),Ìýand again for 2018 data (with 2017 being shown for both old and new methods).ÌýPreviousÌýapproaches are in Annex A, and the current method summarised below.Ìý
Arrivals statistics currentÌýmethodology. The statistics are compiled on data from three sources:ÌýÌý
-
Data from the Maritime and Coastguard Agency Consolidated European ReportingÌýSystem (CERS), which is based on a mandatory reporting procedure for vessels arriving at UK ports. This includes information on around 100,000 vessel arrivals per year, although some regular services (mostly ferries) are exempt andÌýit appears that some non-cargo vesselsÌýare not covered.ÌýÌý
-
Data collected by DfT for monthly and annual sea passengerÌýstatistics. This source provides information on vessel arrivals for vessels which carry passengers, which includes the vast majority of those not captured by CERS.ÌýÌý
-
Data collected as part of the port freight collection system as outlined above. Both ports and shipping agent returns capture information about cargo vesselÌývoyagesÌýand this information is used where information is not available from one of the above two sources.ÌýÌý
The overall estimates of arrivals are compiled by taking the best estimate from the above three sources for each vessel and port combination and aggregating them.Ìý
Comparison withÌýpreviousÌýapproaches. The main change in the calculation method for 2018 was to replace data previouslyÌýpurchasedÌýfrom Lloyds List Intelligence (LLI) with data freely available from CERS. These sources differ in coverage, particularly for non-cargo vessels and minor ports - some of which are not well covered in CERS. A detailed comparison for the years for which both estimates are available suggests that these are not systematic; in some cases, CERS counts more vesselsÌýand in some casesÌýless, butÌýoverallÌýfor most ports there was a good agreement between the different approaches.ÌýÌý
Users should note that the arrival statistics are best estimates based on the data available, and subject to limitations. In comparing LLI and CERS data, it was noted that some movements within ports (for example, between different terminals within Milford Haven port) were being counted.ÌýSuch movements have been excluded from the figures calculated under theÌýnew approach, wherever possible, which is oneÌýreason whyÌýthe figures on the new basis areÌýgenerally lower.Ìý
VesselsÌýincluded. The ship types included in theÌýarrivalsÌýstatistics are shown in the table, these are unchanged from theÌýpreviousÌýapproach. In table PORT0602, totals are shown for all cargo vessels - excluding passenger and other vessels - for consistency withÌýpreviousÌýapproaches, and because the trends for these vessel types are likely to be more robust in general.
| Ship type | Trading status | Vessel types included (based on Maritech world fleet data) | |
|---|---|---|---|
| Tankers | Trading | Oil tanker, chemical tanker, liquid gas tanker, other tanker | Ìý |
| Ro-ro vessels | Trading | Ro-ro passenger, ro-ro other cargo | Ìý |
| Fully cellular container vessels | Trading | Container (fully cellular) | Ìý |
| Other dry cargo vessels | Trading | Bulk carrier, refrigerated cargo, specialised carrier, general cargo | Ìý |
| Passenger* | Trading | Passenger, cruise | Ìý |
| Other vessels* | Non-trading | Offshore, dredging, bunkering tanker | Ìý |
| Not included | Non-trading | Fishing, towing/pushing craft, other work vessels, non-seagoing ships, non-merchant ships,Ìý non-ship structures, vessels of unknown or unrecorded type | Ìý |
‘Other vessels’ only includes those vessel types which may be carrying cargo which falls within the scope of the port freight collection system –Ìýfor example,Ìýoffshore industry supply vessels (including dual purpose vessels such as anchor handling tug/supply vessels), or dredgers. Work boats which are unlikely to be carrying cargoes falling with the scope of the port freight system are still excluded from the table –Ìýfor example,Ìýtugs, offshore vessels other than supply ships,Ìýsuch as drilling vessels, pilot vessels, research ships, fishing boatsÌýandÌýmilitary vessels.ÌýÌý
It is not possible to match the scope of the port freight system exactly using the vessel type classifications available, and the treatment of some vessels is ambiguous. For example, dredgers may be considered outside the scope of maritime statistics as being ‘work boats’ – however if they land cargo in a port, they are within scope of port freight statistics. Tugs are also excluded, but the cargo in any barges they are towing is again within the scope of port freight statistics.ÌýÌý
The scope of the port freight system is theoretically limited to seagoing traffic – therefore traffic entirely within inland waters is excluded. The principal examples of inland waters traffic – Isle of Wight ferry services – are also excluded from the ship arrivals tables. It is possible that a small number of inland waters movementsÌýremainÌýin the tables, but it is thought that the numbers involved will beÌýrelatively insignificant.Ìý
Strengths and weaknesses of theÌýdata. The data are thought to giveÌýa very goodÌýgeneralÌýindicationÌýof the overall level of significant seagoing commercial ship movements in the UK, but they are not necessarily completely precise.ÌýÌý
The main limitations on the quality of the data are the accuracy with which major ports report traffic under the port freight system, and the completeness of the CERS data.ÌýÌý
Combining three data sources and using different approaches for different ports and vessel types could introduce inconsistencies. However, checks suggest that forÌýthe majority ofÌýports, the impactÌýof this is likely to be minimal (though there are several ports where the estimation method is known to be less robust).Ìý
Domestic Waterborne Freight (DWF) statisticsÌýÌý
As of the 2019 statistics (published in August 2020), figures for domestic waterborne freight (DWF) are presented alongside the port freight statistics and included in the same statistical release. The publication of the 2020 DWF statisticsÌýwereÌýpostponed to September 2021 following the identification of a data issue which affects the internal flow figures, which affects data from 2015 onwards. Data tables PORT0701 to PORT0705ÌýcontainÌýDWF data.ÌýÌý
DWF statistics are basedÌýlargely onÌýdata collected through the port freight collection system, but processed differently and with someÌýadditionalÌýsources, which include:ÌýÌý
1)ÌýInclusion of data for inland waterway movements, which comes from a survey of barge operators, further information for inland movements (such as between Liverpool and Manchester) collected as part of the port freight system but not included in the port freightÌýfigures, andÌýestimates for minor ports. It should be noted that when looking at internal waterways traffic, in 2019, more companies responded the Barge Survey and hence, internal waterways traffic may have seen an increase in their annual figures because of this.ÌýÌý
2)ÌýCounting coastwise movements in only one direction; in the port freight statistics, coastwise domestic movements are reported twice - by the inwards and outwards ports. For DWF, one direction is counted (which is the one with the highest tonnage reported overall)ÌýÌý
3)ÌýCalculation of figures for good moved, as well as good lifted (for example,Ìýtonnage)ÌýÌý
ThereÌýareÌýseparate notes and definitions for the DWFÌýstatistics which cover theÌýmethodologyÌýused in more detail.Ìý
Published tables and revisionsÌý
Publication arrangements: Provisional and final statisticsÌý
Port freight statistics are published in two stagesÌýin order toÌýput usable information in the public domain as early as possible:ÌýÌý
(1) Provisional quarterly results are published approximately 10 weeks after the end of the quarter to which they relate. These statistics are based on high level quarterly returns provided by major ports. Data are available for total weight of goods and number of units, inwards and outwards for each responding port. These figures may be subject to revision ifÌýsubsequentÌýchecks at the year-end highlight anomalies. Typically,Ìýa very smallÌýnumber of ports do not provide data in time for publication, in which case figures are estimated. This usually applies to a small number of ports and has a minimal impact on the overall national trends shown.ÌýÌý
(2) Final detailed annual results are published about 7 months after the year end. These statistics are based on annual returns provided at the end of the year by each major port and minor port. A split into broad cargo type is available for each major port. At thisÌýstageÌýa full reconciliation of port and shipping agent data will have been carried out, and grossing of the final data completed and checked. The detailed results are based on this grossed data. At thisÌýstageÌýthe full range of analyses, including those by route and vessel type are available.ÌýÌý
Prior to the 2018 publication, statistics on DWF were published separately from the port freight statistics, however from 2018 onwards they have been included in one annual publication. Due to the identification of a data issue which affects the internal flow figures, affecting data years 2015 onwards, the publication of the 2020 DWF statisticsÌýwereÌýpostponed to September 2021.ÌýIn 2025 the publication of the 2024 DWF statistics is postponed to December 2025 to allow for upgrades to the database software.Ìý
PORT data tablesÌýÌý
Data tables published as part of the port freight series, including thoseÌýcontainingÌýdata on ship arrivals and domestic waterborne freight, have theÌýprefixÌýPORT. Details of changes to published tables and how we work with users are given in the background quality report, but recent changes include:ÌýÌý
- for the 2017 statistics (published 2018), the format of the data tables was revised, introducing ‘filterable’ data tables to provide a greater range of information to users. A mapping between the old and new table numbers is available on the data tables page.
- for the 2018 statistics (published in 2019), more minor changes were made, in particular the presentation of the arrivals tables (PORT0601ÌýandÌýPORT0602) was changed to be more in line with the other port freight tables.
- for the 2019 statistics (published in 2020), more minor changes were made, in particular adding gross tonnage values to the arrivals table PORT0601
Downloadable data file (PORT0499). This special file is designed to allow advanced users to filter for or download data for their own analyses. The data are disaggregated as far as is consistent withÌýmaintainingÌýcommercial confidentiality. Most of our published tables also have the raw data available within a ‘Data’ worksheet for use by interested users. PORT0499ÌýcontainsÌýdata by number of tonnes as well as units. Note that not all unitised cargo typesÌýare capable of carryingÌýcargo, therefore tonnage andÌýunitsÌýresults should only be compared for those types ofÌýunitÌýwhich can do so.ÌýÌý
The tablesÌýcontainÌýdata by year (from 2000), UK port, region of loading/unloading, country of loading/unloading, cargo category (at twoÌýdifferent levelsÌýof detail) and direction of movement.ÌýVery smallÌýflows have been aggregated to world region totals to helpÌýmaintainÌýconfidentiality.Ìý
SmallÌýflows. Small flows are defined by direction of travel and consist of unitised traffic weighing less than 500 tonnes andÌýcontainingÌýless than 200 units, or non-unitised traffic weighing less than 500 tonnes. In some of the data tables, these small flows are aggregated to preserve theÌýcommercial sensitivity of our data providers, as otherwise this data couldÌýidentifyÌýspecific shipping lines or agents.
RevisionsÌýÌý
Due to increased engagement with data providers, to better understand their data collection processes and systems, we have identified that some of the previous few years of data needed to be revised. The maritime statistics team will continue to engage with data providers and make quality improvements to the data to increase accuracy.ÌýThese are outlined below.
Where there are notable changesÌýimpactingÌýon coverage of the published figures, these are noted in relevant changes. For example, Stranraer port closed in NovemberÌý2011Ìýand its operations were transferred to neighbouring Loch Ryan port.ÌýÌý
Aside from the scheduled updating of the provisional figures noted above, revisions are occasionally made to correct inaccuracies. This includes minor corrections as follows.Ìý
1)ÌýStatistics during 2013 for freight handled by UK ports were revised to correct a small error found in the final statistics published on 27 August 2014. The original statistics included some underreporting due to a data supply issueÌýidentifiedÌýthrough ongoing quality assurance processes.ÌýÌý
2)ÌýStatistics during 2016 were revised to correct for a small error found in the tables and release published in September 2017.ÌýÌý
3)ÌýDuring the production of the new published data tables in 2018, a series of minor errors were found on historical tables, mostly related to operations transferring between co-located minor ports and a reallocation of some cargo volumes (totals are notÌýaffectedÌýas a result). These have beenÌýindicatedÌýwith an ‘r’ on the relevant table for that data point.ÌýÌý
4)ÌýFor the 2018 statistics, a minor revision was made to the vessel arrival statistics (tablesÌýPORT0601 and PORT0602)Ìýfor Cairnryan port for years 2014Ìýto 2016, to correct some double countingÌýidentified.ÌýÌý
5)Ìý2019 statistics were revised in the 2020 publication, published on 14 July 2021, due to volumesÌýsubmittedÌýfor three ports - Goole, Grimsby &ÌýImminghamÌýand Hull - being incorrectly inputted by the data provider. These revisions have resulted in there being an overall decrease in the volume of tonnage, and increase in the volume of units, between 2018 and 2019, which contradicted the originalÌýfigures.ÌýTEU’s rose over the same period, but to a lesser extent after the revision. A summary of the revisions can be found in the below tables, as well as a cargo group breakdown of the changes for Grimsby & Immingham, and Hull, whichÌýwere revised the most. Goole’s Other General Cargo traffic was the only group that was revised, down 5% from the original figure - 732 thousand tonnes – to 692 thousand tonnes.Ìý
6)ÌýFigures for minor port Garston figures have been revised for 2020 and 2021, as data providers for this port were able to provide figures for these years in 2022. We had previously not received anyÌýdata for Garston for years 2020 and 2021. Minor port and all port totals for these years may therefore be different to previously published data tables.Ìý
7) Figures for POR0605 have been revised for the year 2021 due to an error with the data which has now been corrected.Ìý
8)Ìý2021 statistics were revised in the 2023 publication, due toÌýunit volumesÌýbeing incorrectly inputtedÌýby the data provider forÌýHarwich. This revisionÌýhasÌýresulted inÌýthere being an overall increase in the volume of units.Ìý
9) 2022 statistics were revised inÌýthe 2023 publication, dueÌýto volumesÌýsubmittedÌýat Hull being incorrectly inputted by the data provider. This revision has resulted inÌýthere being an overall increase in the volume ofÌýtonnage, andÌýdecrease in the volume of units.Ìý
10) 2019 – 2023 statistics for London, for Ro-Ro and Lo-Lo traffic were revisedÌýin the 2024 publication, due toÌývolumes for these cargo categoriesÌýincorrectly inputted by the data provider.ÌýThis revision has resulted in there being an overall increase in the volume of tonnage of Lo-Lo and decrease in tonnage of Ro-Ro.Ìý
11)Ìý2019Ìýstatistics were revised in the 2024Ìýpublication, due toÌýRo-RoÌývolumesÌýsubmittedÌýat Hull being incorrectly inputted by the data provider. This revision has resulted in there being an overall decrease in theÌýnumberÌýof units.Ìý
12)ÌýFigures for minor portsÌýBrightlingsea and Gill’s Bay ScotlandÌýfigures have been revised for 2023Ìýin the 2024ÌýpublicationÌýas data providers for this port wereÌýnotÌýable to provide figuresÌýin 2023. Minor port and all port totals for these years may therefore be different to previously published data tables.Ìý
Strengths and weaknesses of these statisticsÌý
Port freight statistics undergo an extensive data validation exercise comparing data obtained from UK ports with data from shipping agents and operators (outlined in the background quality report). It is also possible to assess the quality of port freight statistics by comparing with other National Statistics, such as those produced by Her Majesty’s Revenue & Customs (HMRC).ÌýÌý
Port freight statistics: Comparison with related data sourcesÌýÌý
HMRC’s Overseas Trade statistics record the movement of goods for trade purposes between the UK and non-EU countries. Detailed documentation of this system is available on the Ìýwebsite.ÌýÌý
DfT analysis of HMRC bulk customs data
DfT have pulled HMRC’s bulk downloads into a GCP database, to allow consistent and reproducible analysis by mode, commodity and country.Ìý
Because the “mode of transport� field is often incomplete, DfT have used the port of entry/exit to define modes, but validated this against the mode of transport where available.
This method results in 11% of records, 10% of weight and 11% of value having an unknown mode of transport. Some of these unknowns are nulls, some are suppressed by HMRC for sensitivity, and some have an unknown port of location, which can occur when goods are cleared at an inland clearance point. Analysis of the HMRC ‘mode of transport’ for these unknown port of locations suggests that there is no modal bias in the unknown fields, they have therefore been disregarded for the percentage calculation.
HMRC allow a port of entry/exit as “Dover/Eurotunnelâ€� when mode of transport is not known at the point of submitting the customs declaration, therefore it’s not possible precisely estimate the split between rail and sea, hence the rounding of the proportion splits for modes. For more information regarding the data, please seeÌý.
The two datasets can be compared to investigate whether there are similarities in reporting coverage and whether international port freight trends for imports and exports are consistent over time. Overall, the two data sources follow a similar trend in recent years, however, HMRCÌýimportÌýand export statistics tend to be consistently smaller than those from DfT port freight statistics. It should be noted that HMRC reports the location of where the goods are cleared through customs, and this may be different from the port where the goods entered or exited the country.
Further information and lookups
Full list of current and previous ports included in port freight statistics
View inÌýPort and Domestic Waterborne Freight Table Information. Includes some where freight operations have ceased.
Ports, port groups and freight waterways
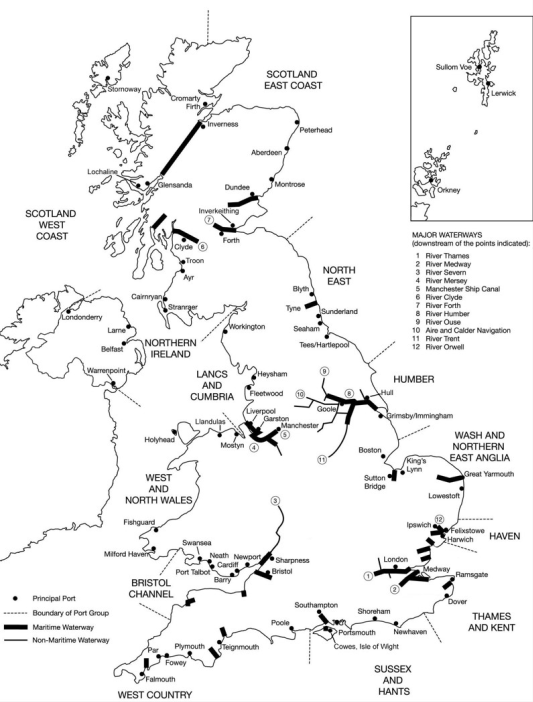
Cargo classification of port freight traffic
View the cargo categories for the EC Directive on statistical returns in respect of the carriage of goods and passengers by sea (2009/42/EC) inÌýPort and Domestic Waterborne Freight Table Information.
Cargo categorisation flowchart
TheÌýÌýis provided to data suppliers to aid in the correct classification of cargo.
Annex A: Historical changes affecting these statistics
Port freight statistics have been collected in various forms for many years, with the current statistics including data back to the 1960’s (for example, tableÌýPORT0101). The current collection methodology for the core port freight statistics was established in 2000, following the introduction of the EU Maritime Statistics Directive. Although the published data series from before 2000 are considered to be largely comparable with the current system, the change in collection methodology resulted in some discontinuities in the data between 2000 and previous years.
Port freight statistics: Previous data collection systems
Annual statistics on freight handled at GB ports have been collected by the Department for Transport since 1980. Statistics for Northern Ireland ports were collected by the Department for Economic Development, Northern Ireland from 1988 to 1999, and have been collected by DfT within the UK system since 2000. Prior to this, similar statistics were collected by the National Ports Council from 1965. There were various relatively modest changes to the collection system during this period; these notes relate mainly to the data collection system from 1995 to 1999.
Prior to 2000 all freight information was collected from ports annually. There was no quarterly collection and no collection from shipping agents. A PS4 form was sent to major ports asking for detailed information on weight of traffic in and out, by cargo category and whether these were foreign, coastwise or one port cargoes. A detailed commodity analysis was also required for bulk traffic, and a broad commodity analysis for coastwise traffic. Separate information was required on unitised traffic, such as the number of units in and out by unitised cargo categories and by broad route. The current system includes more detail than previously on vessels and routes (in terms of the port of loading/unloading) used, and on unitised traffic by weight, but less commodity detail for non-unitised traffic.
The major ports covered by the PS4 were taken to be ports with at least 2 million tonnes of cargo a year. A few selected ports with smaller volumes were also included, which were required to provide only total weight of cargo, in and out, in a simplified form.
Main differences between the freight collection systems in 1995–1999 and from 2000
| Difference | Freight collection system from 2000 | Freight collection system in 1995-1990 |
|---|---|---|
| Traffic Breakdown | More detail on unitised traffic by weight (e.g. by size of container) but less commodity detail on non-unitised traffic. Change to definition of containers on Roll-on/Roll-off services (see table below for full comparison) | Less detail on unitised traffic by weight but more commodity detail on non-unitised traffic (see table below for full comparison) |
| Route and vessel information | Information on individual trips from shipping lines and agents, including port of load and unload, so geographic information should be more accurate. Also vessel details available e.g. LRN and flag. Summary data only from ports, on traffic in and out of ports, quarterly | No information from shipping lines and agents and no vessel data. Detailed information annually from ports, but aggregated – no individual trips identified, so geographic information is likely to be less accurate |
| Definition of major port | Major ports (52 in 2000) are defined as ports with annual cargo volumes of at least 1 million tonnes, plus a few selected ports with less tonnage. Otherwise ports are classified as minor ports | Major ports (39 in 1999) defined as ports with annual cargo volumes of at least 2 million tonnes, plus a few selected ports with less tonnage. Otherwise ports classified as minor ports |
Comparison of cargo categories used in port statistics up to 1999 and from 2000.
1) Weight of Unitised cargo
| Cargo categories in use until 1999 | Cargo categories in use from 2000 |
|---|---|
| Containers on Lo-Lo or conventional services | All container categories |
| Containers onÌýRo-RoÌýservices | If lifted on or off the vessel by crane then containers as above, if loaded using any type of roll-on roll-off trailer then rail wagons shipborne port to port trailers, and shipborne barges engaged in goods transport |
| Powered road goods vehicles and unaccompanied road goods trailers | Both Road goods vehicles with or without accompanying trailers and Unaccompanied road goods trailers and semi-trailers respectively |
| Rail wagons and barges carried on ships | Rail wagons, shipborne port-to-port trailers, and shipborne barges engaged in goods transport |
| Vehicles for import and export onÌýRo-RoÌýservices | Import/Export motor vehicles |
| Other wheeled andÌýRo-RoÌýfreight | Both Other mobile self-propelled units and Unaccompanied caravans and other road, agricultural and industrial vehicles Other mobile non-self-propelled units |
2) Weight of non-unitised cargo
| Cargo categories in use until 1999 | Cargo | Cargo categories in use from 2000 | Cargo |
|---|---|---|---|
| Liquid Bulks | Crude petroleum | Liquid Bulks | Crude oil |
| Liquid Bulks | Petroleum products and gas | Liquid Bulks | Oil products, Liquefied gas |
| Liquid Bulks | Animal and vegetable oils and fats, beverages, chemicals, chemical fertilisers, crude minerals, material shipped for dumping at sea, sugar and sugar preparations, and other liquid bulks | Ìý | Ìý |
| Liquid Bulks | Other liquid bulks | Ìý | Ìý |
| Dry Bulks | Ores and scrap | Dry Bulks | Ores and scrap |
| Dry Bulks | Coal, coke and briquettes | Dry Bulks | Coal |
| Dry Bulks | Foodstuffs and tobacco (including animal feeding stuff, dairy products and eggs, fruit and vegetables, meat and meat preparations, milled cereals and cereal preparations, sugar and sugar preparations and unmilled cereals), animal and vegetable oils and fats, and oil seeds and nuts | Ìý | Ìý |
| Dry Bulks | Agricultural products | Ìý | Ìý |
| Dry Bulks | Cement lime, chemicals, crude and manufactured fertilisers, crude minerals, iron and steel, material shipped for dumping at sea, non-ferrous metals, other non-metallic mineral manufactures, petroleum products and gas, sea dredged aggregates, wood lumber and cork, and other dry bulks | Ìý | Ìý |
| Dry Bulks | Other dry bulks | Ìý | Ìý |
| Semi-bulks | Unitised forest products | Other general cargo | Forestry Products |
| Semi-bulks | Other semi-bulk traffic (for example, iron and steel, and palletised cargo) | Other general cargo | Iron and Steel products |
| Conventional Traffic | Other general cargo | General Cargo and Containers <20ft | Ìý |
| Non-Oil Traffic with UK offshore installations | Other general cargo | General Cargo and Containers <20ft | Ìý |
InÌý2025, weÌýintroducedÌýthe collection and reporting ofÌýtwo newÌýcargoÌýcategories.Ìý
-
Wood PelletsÌýare compressed biomass made from wood waste, including wood chip for use as a renewable fuel sourceÌý(previouslyÌýreportedÌýunderÌý‘other dry bulk’).Ìý
-
Wind Farm ProductsÌýincludes blades, tower sections for wind turbines,ÌýcasingsÌýand cablesÌý(previouslyÌýreportedÌýunderÌý‘other general cargo’).Ìý
Port freight statistics: unitised traffic category changes from 2000
The following effects of an important change to the categorisation of ‘containers’ and ‘shipborne port-to-port trailers’ between 1999 and 2000 should be noted.
Containers can be lifted onto ships using conventional services at container ports (Lift-on/Lift-off or Lo-Lo) or they can be loaded onto Roll-on/Roll-off (Ro-Ro) vessels – used principally for road goods vehicles, road goods trailers or passenger cars etc. The latter method often employs ‘port-to-port trailers’ used only within the port and which may return to the quay after loading or stay with the ship (either returning empty from the destination port or with another load).
Until 1999, Lo-Lo containers were included in ‘containers on Lo-Lo and conventional services’ whilstÌýRo-RoÌýcontainers were classified to ‘containers onÌýRo-RoÌýservices’. From 2000 the category ‘containers onÌýRo-RoÌýservices’ was discontinued and a new category introduced called ‘rail wagons, shipborne port-to-port trailers and barges’. Most containers previously recorded by respondents asÌýRo-RoÌýcontainers were subsequently recorded as ‘rail wagons, shipborne port-to-port trailers and barges’ but it is believed others were recorded as containers on Lo-Lo services. The effect of this definitional change can be seen inÌýPORT0103.
It was evident by 2005 that some respondents operating atÌýRo-RoÌýports were indeed incorrectly reporting containers transported on port-to-port trailers as Lo-Lo containers and had been doing so since the start of the new data system in 2000. This was corrected for 2005 when data providers were given further guidance.
Revised estimates for 2000 to 2004 for containers and shipborne trailers etc are provided in the table below.
The adjustment shown was calculated using updated information obtained from ports together with information from shipping lines and published sources. Comparative data is shown for 2005 to 2007. Note that the original figures for 2000 to 2004 have not been adjusted in the published tables.
It should be noted that in both the previous and current data collection systems containers carried by road goods vehicle or road goods trailer are correctly classified as ‘road goods vehicles’ or ‘unaccompanied trailers’ and not as containers.
Containers and shipborne trailers, etc: 2000 – 2007 (thousand units):
| 2000 | 2001 | 2002 | 2003 | 2004 | 2005 | 2006 | 2007 | |
|---|---|---|---|---|---|---|---|---|
| Containers | 4,325 | 4,646 | 4,506 | 4,533 | 4,919 | 4,754 | 4,883 | 5,381 |
| Shipborne trailers, etc (original) | 361 | 344 | 348 | 374 | 383 | 665 | 668 | 744 |
| Adjustment to containers | -116 | -157 | -230 | -265 | -299 | NA | NA | NA |
| …Of which London | 32 | -74 | -173 | -158 | -166 | NA | NA | NA |
| Adjustment to shipborne trailers etc | 116 | 157 | 230 | 265 | 299 | NA | NA | NA |
| …Of which London | -32 | 74 | 173 | 158 | 166 | NA | NA | NA |
| Containers (adjusted) | 4,209 | 4,309 | 4,276 | 4,268 | 4,620 | 4,754 | 4,883 | 5,381 |
| Shipborne trailers etc. (adjusted) | 477 | 501 | 578 | 639 | 682 | 665 | 668 | 744 |
Ship arrivals statistics: Previous methods
The approach used to produce the ship arrivals statistics has changed several times since they were first published. The current approach was established for the 2018 statistics. Details of previous approaches are given here.
Method until 2009:ÌýThe scope of these estimates was cargo carrying trading vessels. The primary source used was commercially obtained vessel movement data from LLI. LLI maintain a global vessel movement database, based on a variety of sources, principally daily reports from an established network of Lloyd’s Agents and sub-agents, and increasingly also vessel tracking data from transponders which most vessels are now required to carry under maritime safety rules. LLI aim to cover “the deployment of all self-propelled sea going merchant vessels over 99 gross tons engaged in international seaborne tradeâ€�. The data obtained by DfT certainly includes domestic movements between UK ports, but it may be reasonable to suppose that data coverage could be less comprehensive in this category, particularly for small vessels, and/or those on very local or inshore routes.
The LLI data do not cover individual movements on frequent services (those with more than one call per day at the same port – mainly ferry services), so information on the number of these movements was compiled for DfT by a separate contractor and added to the total.
Method from 2009 to 2017:ÌýIn 2012, new tables were released for 2009 and 2010, using a similar but revised method. These changes replaced a source of information on ‘frequent services’ no longer available, made better use of information already held, and expanded the scope of the table to cover non-cargo vessels. In tableÌýPORT0602, historical data are retained to allow comparisons to be made between the previous and revised approaches. The new method added about 5,000 vessel movements not identified by the old method (a 4% increase in the total) from the ‘fully cellular container’ to the ‘other general cargo’ category. This also applied to over 13,000 movements by vessel types not previously included, and over 1,000 arrivals of general cargo ships with container capacity, many of which were probably running container services.
LLI data continued to be an important basis of the method. However, it was merged with other information on ship movements obtained by DfT through the port freight collection system (all cargo or passenger carrying movements at major ports) and its sea passenger survey (movements on regular seagoing ferry services). The three data sources are merged at the level of individual vessels calling at each port. The maximum number of calls from any of the three sources is taken as the final estimate. In the small proportion of cases where it is not possible to match vessels to other sources, these movements are also included in the total for the relevant port.
A further difference in the method used from 2009 is that in nearly all cases vessel type is based on IHS Global world fleet data. Under the old method (figures to 2009) vessel type information came largely from LLI, except for those vessels on frequent services which did not appear in the LLI data set. This change was made because data were being merged from more data sets. In general, LLI and IHS Global sources agree on vessel type, but there are some cases where they differ – since some vessels can be employed in a variety of roles. Generally, this does not make a significant difference to the overall results, but one relatively major change is for smaller container ships. The old method classified LLI’s ‘General cargo with container capacity’ category as container vessels. In general, the vessels in question were employed on container services. However, they were not ‘fully cellular’ – that their container cell guides were not fixed, allowing the vessels to be configured for other cargoes. Therefore, these vessels appear under the ‘other general cargo’ category in the new tables. Consideration was given to whether vessels identified by IHS Global as having container capacity should be included under the ‘container’ category, but this would have led to much larger discontinuities in the opposite direction, with the probability that many vessels operating as general cargo ships would be misclassified as container ships.
Between 2009 and 2010, LLI increased the coverage of their data. The impact of this on the DfT tables results is probably significantly reduced because many of the additional movements recorded by LLI would already have been captured in one of the other sources used in the DfT statistics.