Port freight annual statistics 2025: International routes trends
Published 29 July 2026

© Crown copyright 2026
This publication is licensed under the terms of the Open Government Licence v3.0 except where otherwise stated. To view this licence, visit or write to the Information Policy Team, The National Archives, Kew, London TW9 4DU, or email: psi@nationalarchives.gov.uk.
Where we have identified any third party copyright information you will need to obtain permission from the copyright holders concerned.
This publication is available at /government/statistics/port-freight-annual-statistics-2025/port-freight-annual-statistics-2025-international-routes-trends
You can use ourÌýÌýto explore port freight trends.
These areÌýÌýand were independently reviewed by the Office for Statistics Regulation inÌýDecember 2018. For more information, see theÌýAbout these statistics section.Ìý
Port freight trends by routeÌý
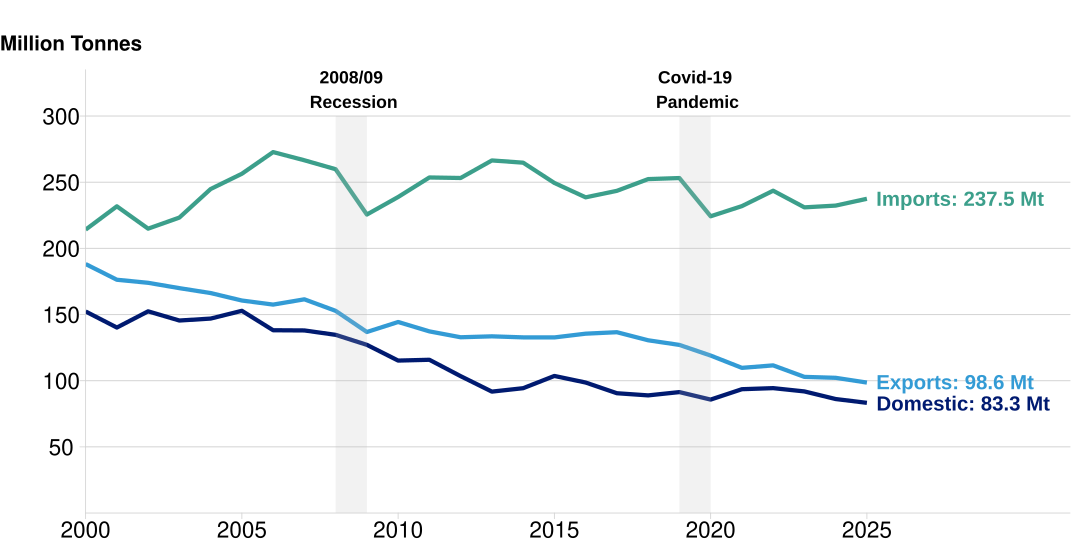
Chart 12Ìýshows trends in international and domestic tonnage at UK ports.ÌýTotal international traffic (imports and exports combined)ÌýshowedÌýlittle changeÌýin 2025 compared to 2024, increasingÌýless than 1%ÌýtoÌý336.1Ìýmillion tonnes.ÌýÌý
TheÌýsmall overall changeÌýin total international freightÌýmasksÌýopposingÌýtrendsÌýin imports and exports.ÌýWhile imports increasedÌý2%ÌýtoÌý237.5ÌýmillionÌýtonnes in 2025, exports decreasedÌý4%ÌýtoÌý98.6ÌýmillionÌýtonnes.ÌýThis is consistent with trends observed since 2000, with imports consistently exceeding exports and exports steadily declining over time, reflecting the UK’sÌýgrowingÌý.ÌýÌý
In 2025, domestic trafficÌýdecreased byÌý3%Ìýfrom 2024ÌýtoÌý83.3Ìýmillion tonnes. Domestic trends are explored in more detail in theÌýdomesticÌýtrends chapter.ÌýÌý
Chart 12: Major port international freight by direction and domestic freight from 2000 to 2025Ìý(PORT0205)ÌýÌý
Ìý
DefinitionsÌý
Short sea: maritime traffic that moves cargo along a coast without having to cross an ocean. This consists of traffic to and from European Union (EU) and ‘Other Europe and Mediterranean’ countries.Ìý
Deep sea: maritime traffic that crosses oceans. This consists of traffic to and from countries in Africa, America,ÌýAsiaÌýand Australasia. Countries on the Mediterranean coastline, including those in North Africa, are classed under short sea in the port freight series (i.e. Morocco, Algeria, Tunisia,ÌýLibyaÌýand Egypt).Ìý
Transhipment: these statistics collect the port of loading or unloading of the cargo, which may not be the port of ultimate origin or destination. For example, if a ship carrying cargo from Asia unloads/loads the cargo at a European port which is then put on another ship to the UK, our statistics will state the port of load as the European port, rather than the port in Asia.Ìý
Liquified natural gas (LNG) is natural gas which has been cooled to approximately -160°C, changing its state from gas to liquid. This enables transportation of gas by ship, as the volume is significantly reduced compared to the gaseous state.ÌýFollowing import, LNG is regasified at a terminal and then transported through the gas pipeline network.
International freightÌý
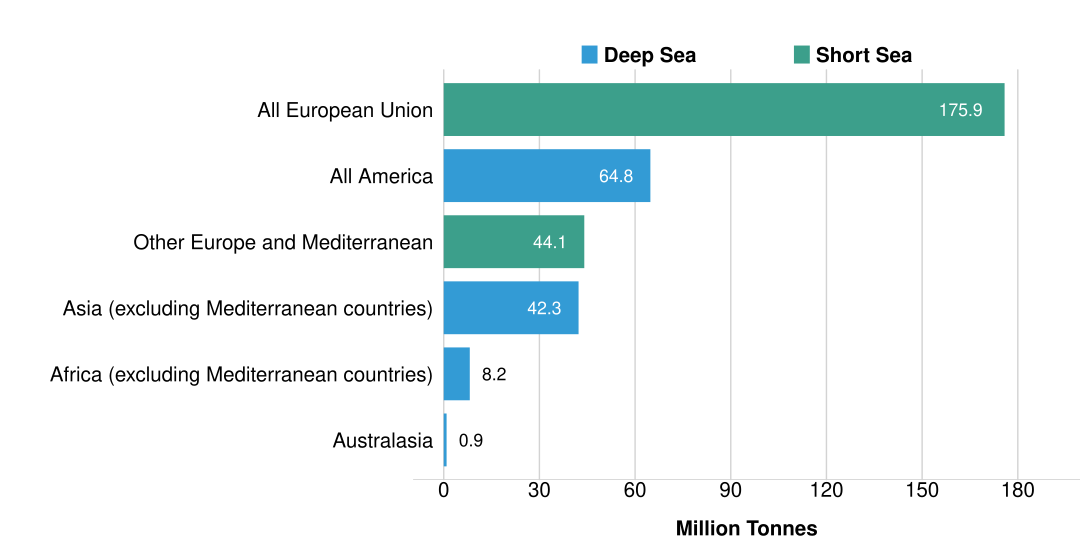
Chart 13 is a bar chart showing tonnage handled by UK ports by international region. In 2025Ìýshort sea trade accountedÌýfor 65% ofÌýinternational UK tonnage traffic (comparedÌýto 35% forÌýdeepÌýsea routes).ÌýÌý
Tonnage moved through ports in the European UnionÌýaccounted for 52%Ìýof all international tonnage trafficÌýinÌý2025ÌýandÌýremainedÌýthe UK’sÌýlargestÌýtradingÌýregion, despiteÌýdecliningÌý3.0 million tonnes (2%) from 2024.ÌýIn 2025,ÌýAll America routes had the largest absolute increase ofÌý4.7Ìýmillion tonnes (upÌý8%Ìýfrom 2024), followed by All Asia routesÌýthat increased byÌý2Ìýmillion tonnes (5%).ÌýÌý
Chart 13: International freightÌýtonnage by routeÌýregion, 2025Ìý(PORT0204)Ìý
Ìý
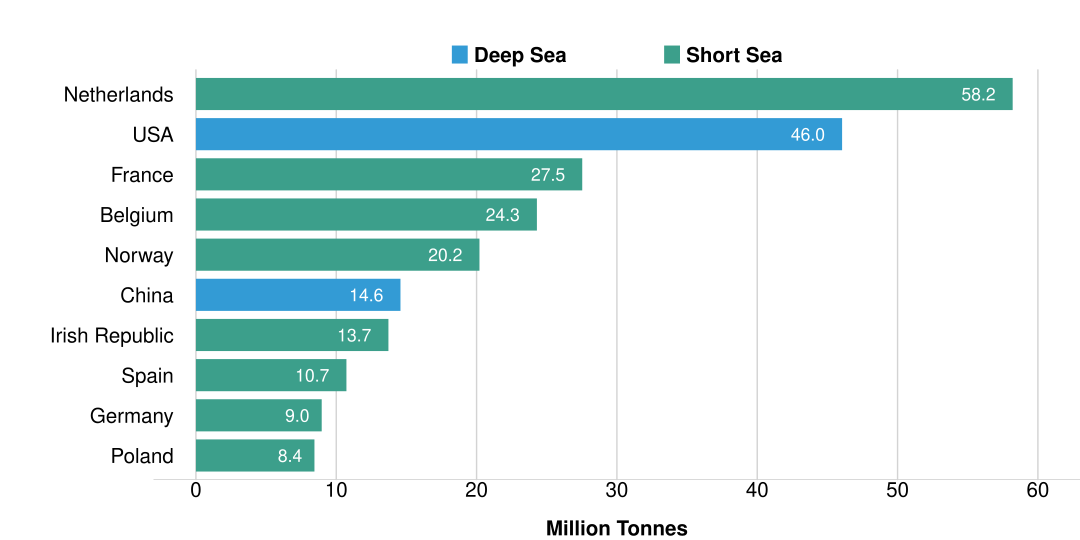
Chart 14Ìýis a bar chartÌýshowing tonnage handled by UK ports byÌýthe top 10 countries.ÌýInÌý2025,ÌýThe NetherlandsÌý– home to several major –ÌýaccountedÌýforÌý17% ofÌýallÌýUKÌýinternational tonnageÌýtraffic,Ìýmore than anyÌýother country andÌýconsistent withÌýpreviousÌýyears.ÌýThis was closely followed by the USA,Ìýwhich accounted forÌý14%ÌýofÌýinternational tonnage traffic.ÌýTonnage from theÌýUSA had the absolute largest increaseÌýof any country inÌý2025,ÌýincreasingÌý2.9ÌýmillionÌýtonnes (up 7% fromÌý2024).Ìý
TheÌýtop 10ÌýcountriesÌýaccountÌýforÌý69% ofÌýall UK major port international tonnage in 2025.ÌýInternational route trends are discussed in more detail in theÌýInternationalÌýcargo group trends section below.Ìý
Chart 14:ÌýTop 10Ìýinternational freight tonnage byÌýcountryÌýroute, 2025 (PORT0204)Ìý
Ìý
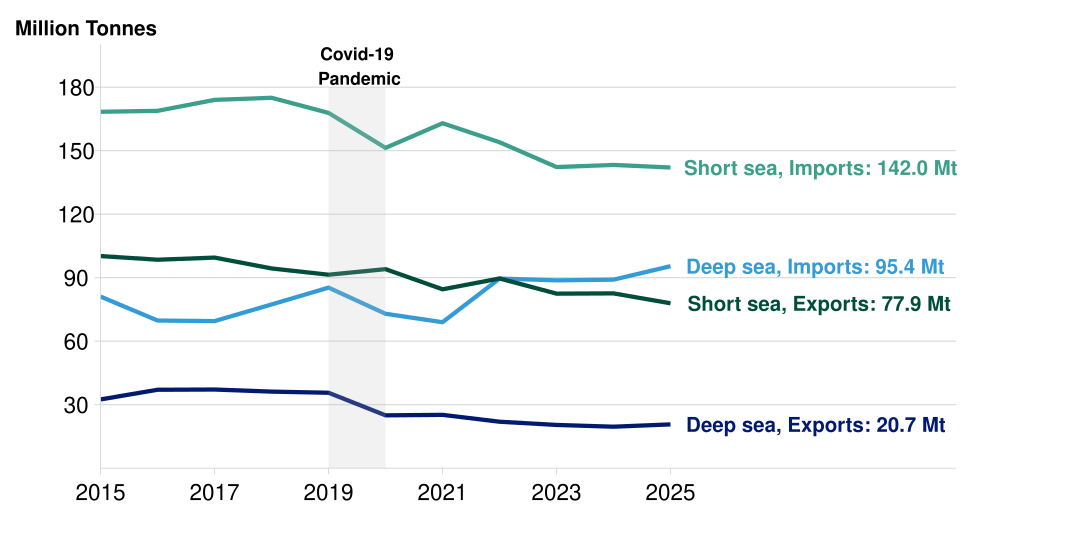
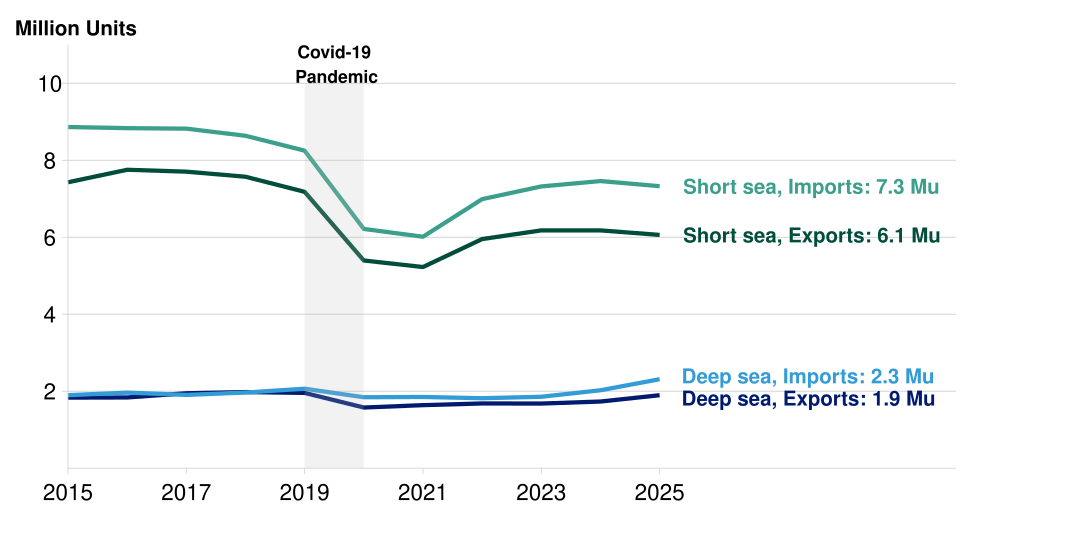
Charts 15Ìýand 16  show trends inÌýshort seaÌýand deep sea tonnageÌýand unitised import and export trafficÌýover the last decade.ÌýUnitised container importsÌýand exports typically follow similar trends with both increasing (acrossÌýdeep and short sea) in 2025 compared to 2024.ÌýHowever,Ìýtrends inÌýimport and export tonnageÌýtend to divergeÌýbecause the UK importsÌýmore goodsÌýthan it exports,Ìýresulting in the export ofÌýempty containers (thatÌýhave a unitised value, but no tonnage), both on deep and short sea routes.
Chart 15: InternationalÌýshortÌýand deep sea tonnage from 2015Ìýto 2025Ìý(PORT0204)Ìý
Ìý
Chart 16: InternationalÌýshortÌýand deep sea unitised traffic from 2015Ìýto 2025Ìý(PORT0204)Ìý
Ìý
Overall, in 2025, total internationalÌýshort seaÌýtraffic (imports and exports combined)Ìýdecreased from 2024, both in terms of tonnage, downÌý5.9 million tonnes (3%),Ìýand units, downÌý0.3 million units (2%).ÌýBy contrast, deep sea traffic increased from 2024Ìýto 2025 byÌý7.5 million tonnes (7%)ÌýandÌý0.5 million units (12%).Ìý
International cargoÌýgroupÌýtrends
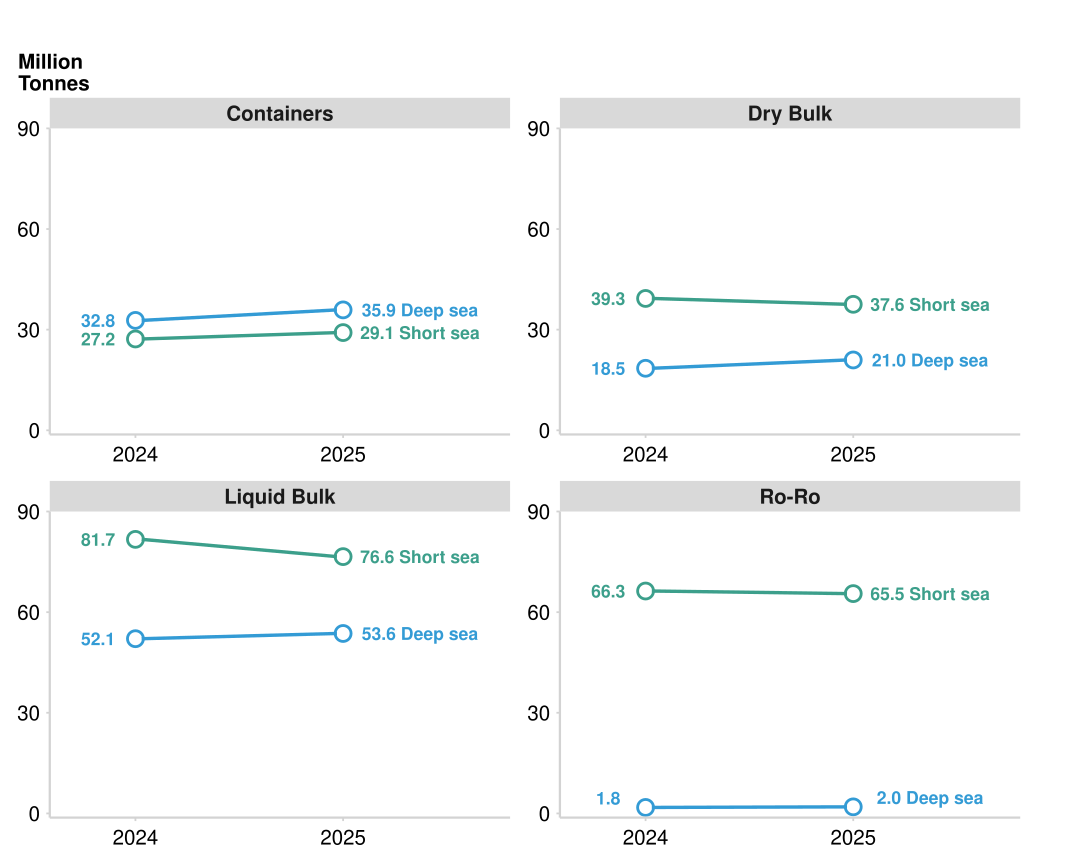
Chart 17ÌýshowsÌýchanges in deep and short seaÌýtonnage by cargo groupÌýfrom 2024 to 2025.ÌýLiquidÌýbulk was the largest categoryÌýin 2025Ìýacross bothÌýshort sea andÌýdeep sea traffic, accountingÌýforÌý35%ÌýandÌý46%ÌýofÌýtonnageÌýrespectively.ÌýÌý
For short sea routes,ÌýRo-RoÌýwasÌýthe second largestÌýcargo category for tonnage traffic (30%Ìýin 2025),ÌýmainlyÌýonÌýthe shortest crossingÌýroutesÌýbetween the UK and mainlandÌýEurope (i.e.ÌýFrance, The Netherlands andÌýBelgium).ÌýForÌýdeep seaÌýroutes, container traffic was the second largestÌýcategoryÌýforÌýtonnageÌý(31%Ìýin 2025),Ìýprimarily shipments from China.ÌýÌý
Chart 17:ÌýShort and deep seaÌýtonnage byÌýcargo group,Ìý2024 to 2025 (PORT0204)Ìý
Short sea trafficÌý
In 2025,Ìýshort seaÌýtonnageÌýdecreasedÌýacross importsÌý(downÌý1% fromÌý2024)Ìýand exportsÌý(downÌý6%).ÌýThisÌýdeclineÌýwasÌýlargelyÌýdrivenÌýbyÌýaÌý6%ÌýdecreaseÌýinÌýliquid bulkÌýandÌýaÌý4%Ìýdecrease inÌýdry bulk,ÌýwithÌýaÌýsmaller decline in Ro-RoÌý(1%).ÌýBy contrast,Ìýcontainer short sea traffic increasedÌý7%ÌýinÌý2025.ÌýÌý
Liquid bulk moved on short sea routes had the largest absolute decline of anyÌýshort seaÌýcargo groupÌýin 2025,ÌýdownÌý5.1Ìýmillion tonnesÌýfrom 2024Ìý(6%),Ìýwith this decreaseÌýprimarily reflecting fewerÌýexports.ÌýMost ofÌýthisÌýdeclineÌýwasÌýonÌýroutesÌýto The NetherlandsÌýwithÌýlargeÌýdecreasesÌýinÌýoil productÌýexports, downÌý1.7Ìýmillion tonnes (20%)Ìýand crude oil exports, downÌý0.6 million tonnes (15%).ÌýAccording to theÌýDESNZ Energy TrendsÌýreport, thisÌýreflectsÌýthe near-record low year for primary oil production from the mature North Sea basinÌýin 2025, as well as the record UK lows for product refinery output after the closure of the Grangemouth and Lindsey oil refineries - this lead to decreased refinery demand and fewer liquid bulk shipments to the Netherlands, Europe’s major trading hub for oil.Ìý
Compared to 2024, containersÌýhad the largest absoluteÌýincrease in short sea traffic,ÌýupÌý1.9Ìýmillion tonnesÌý(7%)ÌýandÌý0.1ÌýmillionÌýunits (3%)Ìýin 2025,Ìýwith rises in both imports and exports.ÌýMost ofÌýthis increase was onÌýroutes with The Netherlands withÌýtonnageÌýimports risingÌý10%ÌýandÌýexports risingÌý9%Ìýfrom 2024 to 2025.ÌýThisÌýaligns withÌýtheÌýopening ofÌý, providing increased capacity for the handling of container shipments in and out ofÌýthe UK.ÌýThe Netherlands,ÌýÌýwith severalÌýmajorÌýcontainer ports,Ìýis a key route forÌýthe Port of LondonÌý(given its geographical proximity)Ìýand container shipments on this route haveÌýrisenÌý69%Ìýfrom 2024 toÌý2025.
Deep sea trafficÌý
In 2025,ÌýdeepÌýsea tonnageÌýincreasedÌýacross imports (upÌý7% fromÌý2024) and exportsÌý(upÌý6%).ÌýDeepÌýsea tonnageÌýroseÌýin all cargo groups in 2025 with large increases inÌýcontainers, upÌý3.1 million tonnes (10%),Ìýdry bulk,Ìýup 2.5 million tonnes (13%), and liquidÌýbulk, upÌý1.6ÌýmillionÌýtonnesÌý(3%).Ìý
ContainerÌýdeep seaÌýtonnage increasedÌýacrossÌýimports and exports - this was also reflected in increased unitised container traffic, upÌý0.5Ìýmillion unitsÌý(14%)Ìýfrom 2024 to 2025.ÌýThis rise was driven by increased container imports from China, upÌý1.3Ìýmillion tonnes (13%),ÌýandÌýfrom India, upÌý0.5Ìýmillion tonnes (28%).ÌýBoth China and India are major global suppliersÌýof manufactured goods, and the UK continues to increase imports from these countriesÌý(DBT trade and investment factsheets).ÌýChina is the UK’s largest container trading partner with unitised traffic reachingÌý1.8 million unitsÌýin 2025Ìý(accounting forÌý32%Ìýof all unitised container traffic).Ìý
The increase in deepÌýsea dry bulk trafficÌýin 2025 was largely due to increased imports from the USAÌý(upÌý1.9 million tonnesÌýfrom 2024,Ìý22%)Ìýand CanadaÌý(upÌý0.9Ìýmillion tonnes,Ìý39%),ÌýparticularlyÌýofÌýother dry bulk commodities and wood pellets. Rising biomass fuel imports have supported the UK’s renewable energy and decarbonisation objectivesÌý(Biomass Strategy 2023), with imported wood pellets used extensively in biomassÌýpowerÌýgenerationÌý(DESNZ Energy TrendsÌýreport).The USAÌýisÌýthe UK’sÌýprimary supplier of woodÌýpelletsÌýaccountingÌýforÌý77% ofÌýallÌýwood pellet imports in 2025.Ìý
Lastly, increasedÌýdeepÌýsea liquidÌýbulkÌýtrafficÌýwasÌýprimarily driven by greater LNG imports from theÌýUSA,ÌýwhichÌýroseÌý3.7ÌýmillionÌýtonnesÌýfromÌý2024 to 2025 (upÌý53%).ÌýThis increase isÌýconsistent with trends in theÌýDESNZ Energy TrendsÌýreport that showsÌýthe growing importance ofÌýUSAÌýLNG inÌýmeetingÌýUK energy demands.ÌýSinceÌý2022,Ìýthe USAÌýhas been theÌýUK’sÌýlargestÌýliquid bulk trading partner, andÌýin 2025,ÌýimportsÌýfrom theÌýUSAÌýaccountedÌýforÌý74%ÌýofÌýallÌýUK LNGÌýimports.ÌýThis shift has been supported by a major expansion of liquefaction capacityÌýin the USA, which has substantially increased the country’s LNGÌýexports to the global market ().
Background information
The PORT data tables give further detail of the key results presented in this statistical release. They are available from port and domestic waterborne freight statistics.
These notes provide further information such as definitions and a list of UK ports is available in the accompanying port list.
The background quality report provides further information on how the data is collected, quality assured and comparisons with relevant data sources.
Details of Ministers and officials who receive pre-release access to these statistics up to 24 hours before release can be found on the pre-release access list.
Ìý Related data sources
His Majesty’s Revenue and Customs (HMRC) publishes data on tonnage and value to a much more granular commodity level for goods traded internationally. Comparisons between port freight and this source, specifically for certain cargo categories, are explored further in our notes and definitions.
The Department for Energy Security and Net Zero (formerly Department for Business, Energy and Industrial Strategy) publish the Digest of UK Energy Statistics (DUKES) which covers the production and consumption of fuels and energy in the UK.
Information on freight moved by different modes, including a breakdown of domestic freight, is available in Transport Statistics Great Britain.
publish comparative port freight data for European Union countries, which can be used to compare UK ports to those in EU countries.
About these Statistics
These official statistics were independently reviewed by the Office for Statistics Regulation in December 2018. They comply with the standards of trustworthiness, quality and value in the Code of Practice for Statistics and should be labelled .
Instructions for printing and saving
Depending on which browser you use and the type of device you use (such as a mobile or laptop) these instructions may vary.
You will find your print and save options in your browser’s menu. You may also have other options available on your device. Tablets and mobile device instructions will be specific to the make and model of the device.
How to search
Select Ctrl and F on a Windows laptop or Command and F on a Mac
This will open a search box in the top right-hand corner of the page. Type the word you are looking for in the search bar and press enter.
Your browser will highlight the word, usually in yellow, wherever it appears on the page. Press enter to move to the next place it appears.Ìý
Contact us
Maritime and shipping statistics
Email maritime.stats@dft.gov.uk
Media enquiries 0300 7777 878
 Ìý
To hear more about DfT statistical publications as they are released, follow us on X at .